

- What is next for Bitcoin prices, and how could they impact your altcoin trades? Learn more by reading our Bitcoin price outlook for December.
Understanding what is next for Bitcoin prices is key for the crypto markets, even if you don’t necessarily trade Bitcoin and prefer altcoins. In this special report, we look at some key indicators and use them to project where Bitcoin prices are headed. You can use it to make more informed decisions to trade BTCUSD or to help you time your altcoin trades.
Overview
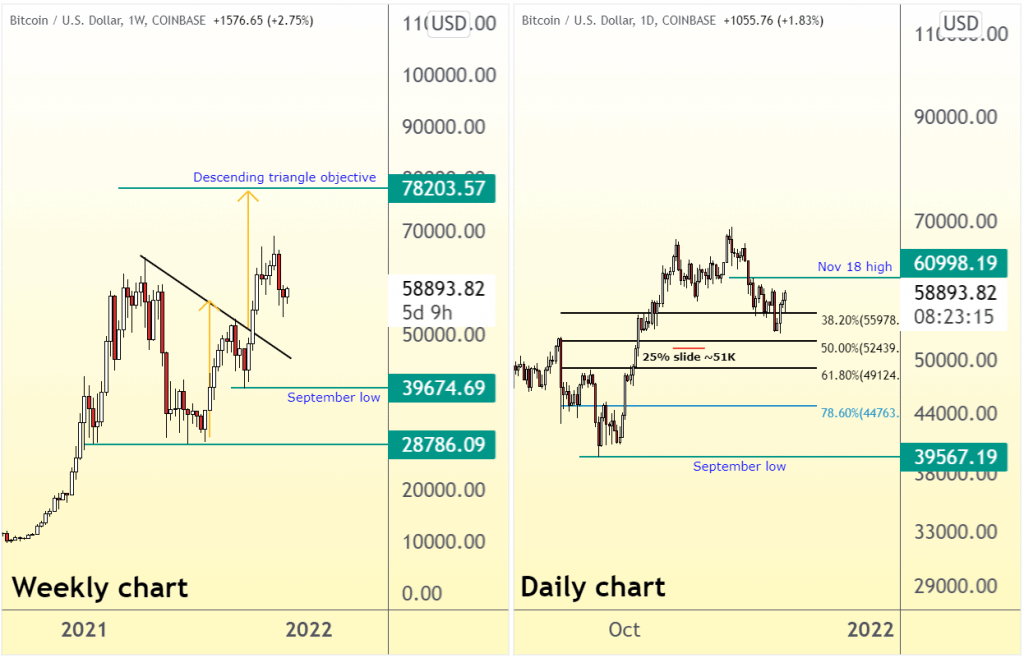
On the weekly chart, Bitcoin prices will remain in a uptrend as long as the price trades above the September low of $39,674. The price could reach as high as $78,203 per the descending triangle pattern that was activated on the first week of October.
The price trend is bearish in the short-term and will remain so as long as we trade below the November 18 high of $60,998. Potential support levels where long term buyers would consider buying are the 50% correction level of the up leg from the September low at $52,264, followed by the 61.8% level at $48,941, and the 78.60% level at $44,571.
But there is another interesting level, and it is the $51,100 level. It rests between the 50% and 61.8% retracement levels. A slide to $51,100 would amount to a drop of 25%, making the decline of the same magnitude as the decline seen in September. Also, as you will see below, the Bitcoin Fear and Greed index supports a low in the same area.
So probably a multi-month low is found around 51K, but not lower than $39674 because if we trade below the September low, the bullish trend would be over, and the price would seek out the July low of 29K.
If the price does not reach 51K, then a break to the November 18 high of $60,998 would terminate the downtrend, and the price could reach 70K, followed by the descending triangle target of $78200. However, we would need to evaluate if the November 28 low at 53K will hold if this were to happen. A slide to 51K is better than the current shallow low of 53K. Also, a break to November 18 high might suggest the worst is over for altcoins
Fear and Greed index
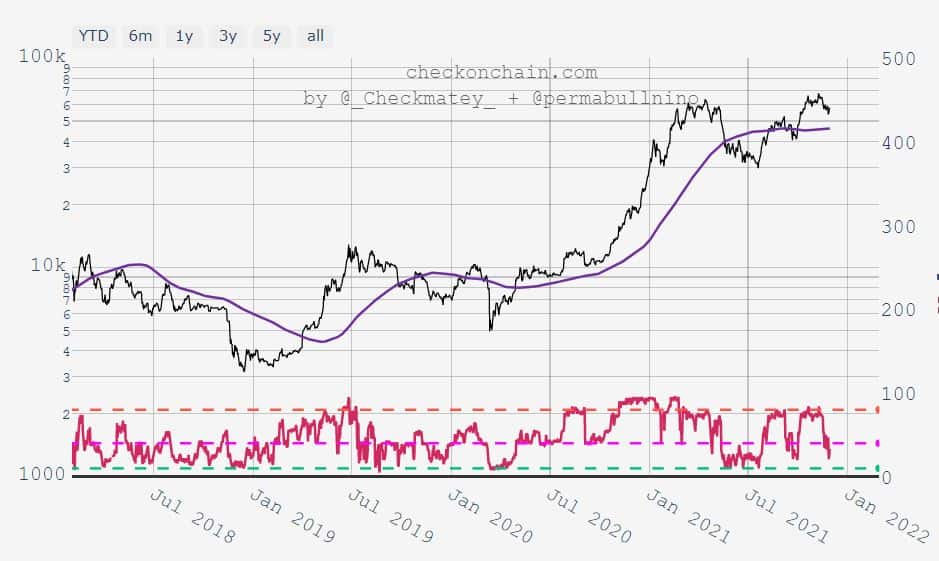
The Fear and greed index suggests that we might have already found a low on November 28, 2021, as the F&G index reached a low of 21.
In the September low, following a 25% slide in Bitcoin prices, the index reached a low of 20. You can see the time series of the index in the lower panel of the image below, whilst the black line is the price of Bitcoin, and the purple line is the MA200.
If Bitcoin prices were to slide from their current price of 58K and reach 51K, this would further suppress the Fear and Greed index and suggest that a multi-month low is imminent.

Funding costs are low, but is it enough?
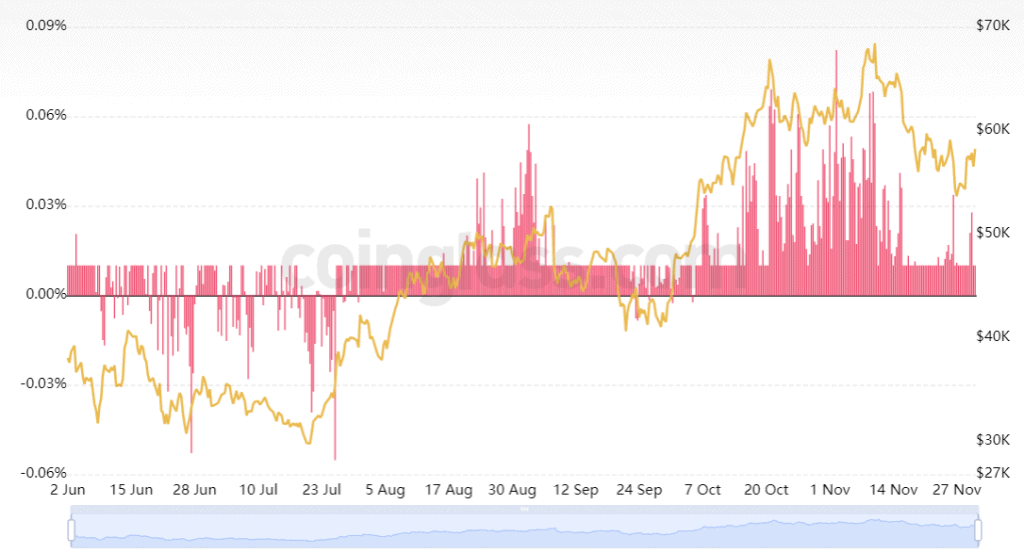
The histogram in the chart below shows that funding costs with Binance were high when Bitcoin prices peaked in November. They were also elevated by the end of August, when the price created a multi-week high.
Today, Binance funding costs have remained low since November 17, but not as long as they were when the price bottomed out in September.
Also, funding costs turned negative with Okex and Bybit in September. But they had not turned materially negative by the end of September.
Funding costs are therefore suggesting that we have still not seen a low in the market. They are also not indicating that we should see a substantial decline.
How high could we trade?
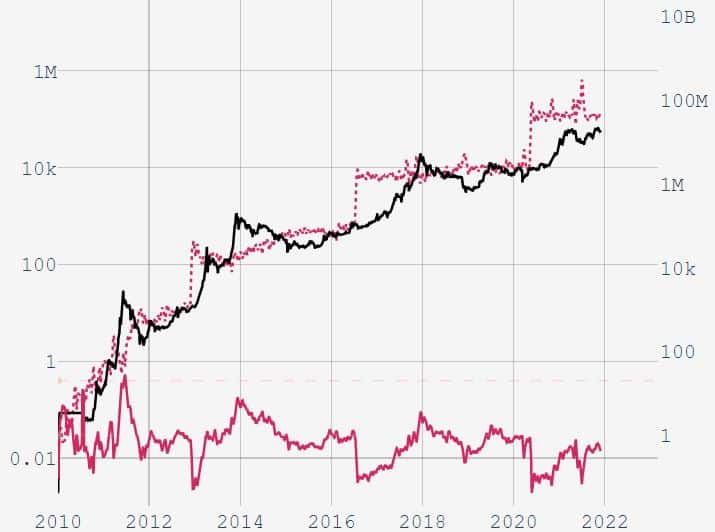
The Bitcoin stock-to-flow model is a long-term model developed by the trader “Plan B”. The price can deviate from the model’s target for many months, so it is vital to use it as a rough estimate. The model suggests that Bitcoin prices should be trading at 142K per coin.
The model also helps us to understand when the price is oversold. And it did so successfully in July when the price was at 29K.
However, this estimate is highly volatile. If the 142K target remains unchanged, the model suggests that a long-term low in Bitcoin prices would be at 10K.
The dotted red line is the price estimate, whilst the black line is Bitcoin prices, and the lower panel shows the ratio between Bitcoin and the estimate.
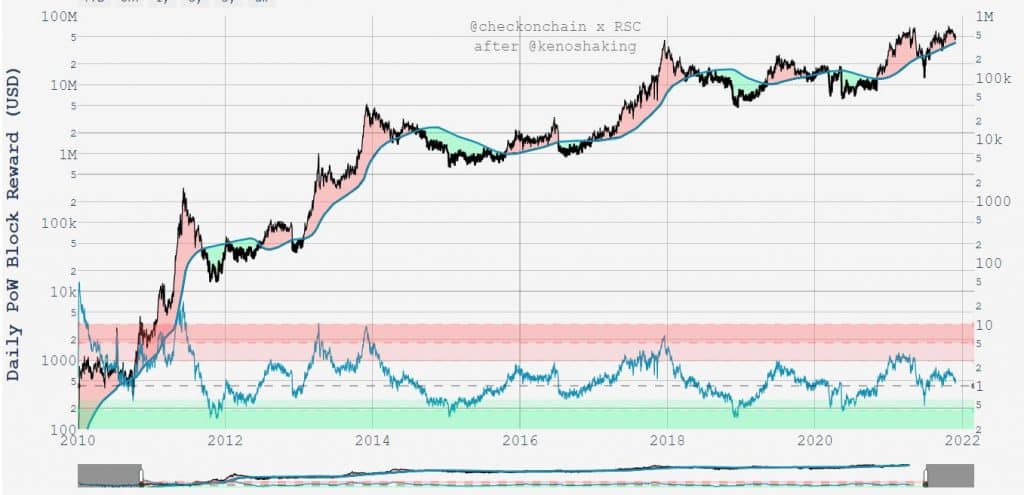
Puell Multiple
The Puell multiple is another model that helped to predict the July low. The model is currently neutral, saying that Bitcoin prices are neither overbought nor oversold. They are giving Bitcoin prices the room to gain and possibly reach the 142K target.
The most significant risks to this Bitcoin outlook
The correlation between stock indices and Bitcoin prices was high when the coronavirus crisis commenced in early 2020. The same type of behaviour is visible again with the flare-up of the latest Omicron variant. Leading South African scientists suggest that the new variant is not more harmful than the Delta variant. But it spreads faster, which could promote further lockdowns worldwide and drag stock markets and cryptocurrencies lower.
