

- AUDUSD is seeing some selling pressure today, slipping below trendline support, after inflation and building approvals data from Australia came in mixed.
After rallying by almost 300 pips from April 22 to April 29, AUDUSD was heavily sold-off on Friday as investors took profit on Labor Day. The currency pair is also seeing some selling pressure in today’s Asian session. This followed after data from Australia came in mixed. Investors could also be squaring their positions ahead of the RBA rate statement tomorrow. As of this writing, AUDUSD is down by 0.51% at 0.6386.
The Melbourne Institute released its inflation gauge for April. The report, which aims to predict the official government data, printed at -0.1% after posting a 0.2% uptick in March. On a more positive note, building approvals for March showed a much lower than expected contraction of 4% than what analysts had forecast at 15%. This suggests that construction activity will not be as sluggish as anticipated in the coming months.
Tomorrow, the RBA is expected to keep rates on hold at 0.25%. Just like the Federal Reserve and the ECB, the central bank has launched massive liquidity programs to support the economy amid the pandemic. What market participants will be looking out for are clues on how long the RBA expects to recover from the coronavirus.
Download our Q2 Market Global Market Outlook

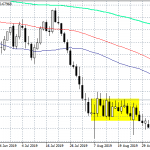
AUDUSD Outlook
On the 4-hour time frame, it can be seen that AUDUSD fell below support at the rising trendline (from connecting the lows of April 3, April 21, and April 23). In technical analysis, this could be considered as a sign that sellers could be dominating the market. Should this be the case, we could see AUDUSD fall to the 0.6200 handle and test support at the 200 SMA.
On the other hand, it’s worth noting that the currency pair is trading around the area where a previous falling trend line is (from connecting the highs of December 31 and March 9) on the daily time frame. It is not uncommon for a market to retest a broken falling trendline for support. With this said, it will not be surprising to see AUDUSD rally to its recent highs at 0.6571 if there are enough buyers in the market.