The Australian dollar pulled back against the US dollar, with the main catalysts being the upcoming American consumer confidence data, Fed decision, and Non-Farm Payroll (NFP). AUD/USD price was trading at 0.7043 on Tuesday, a few points below the year-to-date high of 0.7142.
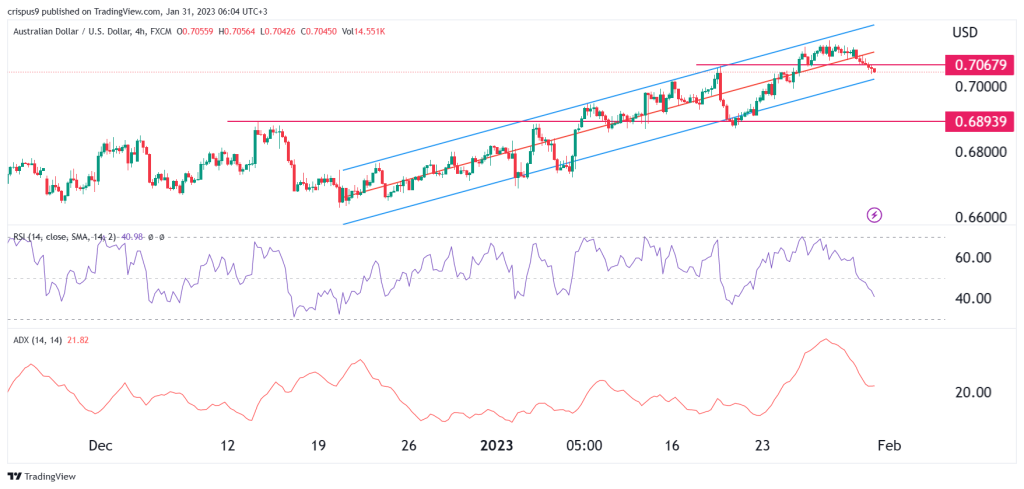
AUD/USD 4H chart analysis
On this chart, we see that the AUD to USD price pulled back modestly as the US dollar index (DXY) rebounded to $102. This dollar comeback is mostly because investors expect that the Fed will sound a bit hawkish even as inflation has dropped in the past six straight months.
The pair has moved below the middle line of the ascending regression channel at 0.7106. Also, as it dropped, it declined below the psychological level of 0.7100 and the crucial support at 0.7067 (January 8 high). Meanwhile, the closely-watched Relative Strength Index (RSI) has pulled back from near the overbought level of 70 to 41. Similarly, the Average Directional Index (ADX) has dropped to about 20.
Therefore, from this chart, the pair will likely drop slightly and retest the lower side of the regression channel at 0.7025 and then turn back around to 0.7125. However, a move below the lower side of the ascending channel will mean that sellers have prevailed, which will bring the next key support level at 0.6894 (December 13) into view.
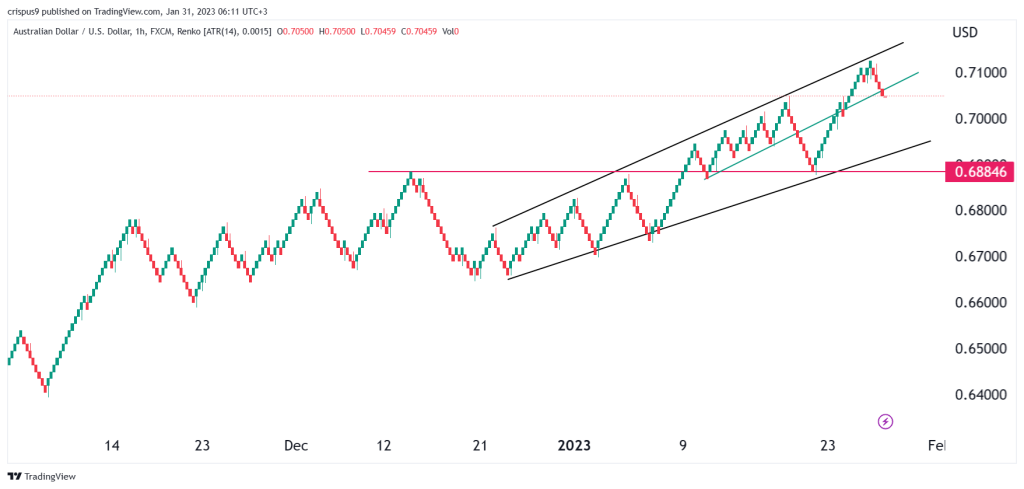
AUD to USD hourly chart analysis
This chart, as you can see, is significantly different from the one we have looked at above. Instead of using a candlestick chart, we are now using the renko chart, which ignores the factor of time and focuses on price. The renko chart reveals that the pair has formed four straight red bars, which is a signal that bears are in the driver’s seat for now.
A precise look also shows that the pair has formed an ascending widening wedge pattern, which is usually a sign of a bearish reversal. It has also declined slightly below the ascending trendline that connects the lowest points on December 10, 12, and 18. Therefore, the chart shows that the pair will likely continue falling in the near term, as sellers target the psychological level at 0.7000 followed by the key support at 0.6885 (Jan 19 low and December 13 high)