Archived Article This article was published more than 5 months ago. The market data, prices, forecasts, and analysis were accurate at the time of publication but may have changed since then. Please use this article for historical reference only and refer to our latest content for current market information.
- The AUD/JPY price moved sideways on Friday after the Reserve Bank of Australia (RBA) published the minutes of this week’s meeting
The AUD/JPY price moved sideways on Friday after the Reserve Bank of Australia (RBA) published the minutes of this week’s meeting. Then, it formed a hammer pattern and rose to a high of 93.85, which was higher than this week’s low of 90.57. So, what next for the AUD to JPY exchange rate?
RBA minutes
The AUD/JPY price tilted slightly after the RBA delivered this week’s meeting minutes. In it, the bank decided to hike interest rates by 0.50% in its bid to fight the red hot inflation. The bank said that it expects that prices will remain high until 2024. It expects inflation to rise to 7.75% by the end of the year and then end 2023 at about 4%.

Still, there are signs that the RBA is again wrong on inflation since the prices of many crucial items have started falling. For example, crude oil prices have dropped to about $90. Oil was trading at over $136 during its peak this year. This is notable since oil is an important part of inflation.
At the same time, the RBA expects the unemployment rate to remain under 4% in 2024, while wages will likely grow slower. The EUR/JPY price rose slightly after the latest data from Japan. The country said that household spending rose by 3.5% in June while overtime pay rose to 5.80%.
AUD/JPY forecast
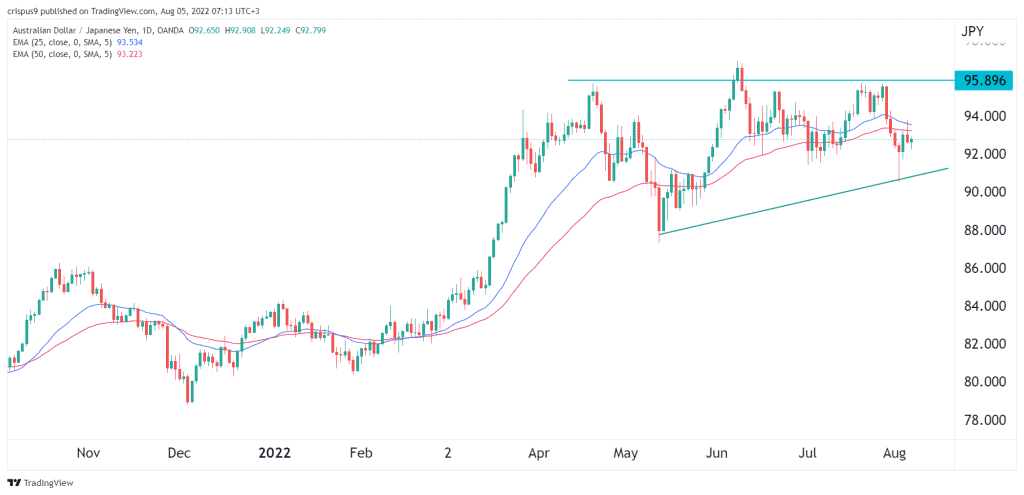
The four-hour chart shows that the AUD/JPY price has been under pressure in the past few days. However, a closer look reveals that it has formed what looks like a triple-top pattern at 95.90. In price action analysis, this pattern is usually a bearish sign. In addition, it has also formed what looks like a head and shoulders pattern and moved below the 25-day and 50-day moving averages.
Therefore, the pair will likely have a bearish breakout in the coming days and move below the support at 90. However, a move above the resistance at 94 will cancel the bearish view.