This week’s response of market participants will decide the AMC stock forecast heading into April. The AMC stock price had a stellar performance in the week ended 25 March, along with other WallStreetBets meme stocks such as GameStop. Central to that performance was the latest investment by AMC Entertainment and an accompanying launch of a set of NFTs titled “There’s Gold in Them Thar Hills”.
This set of NFTs is to celebrate AMC Entertainment’s investment in Hycroft Mining Holding Corporation, a relatively small and unknown gold and silver mining firm. AMC acquired a 22% stake in the troubled mining company, injecting $27.9m in the process as AMC also seeks to diversify its revenue base.
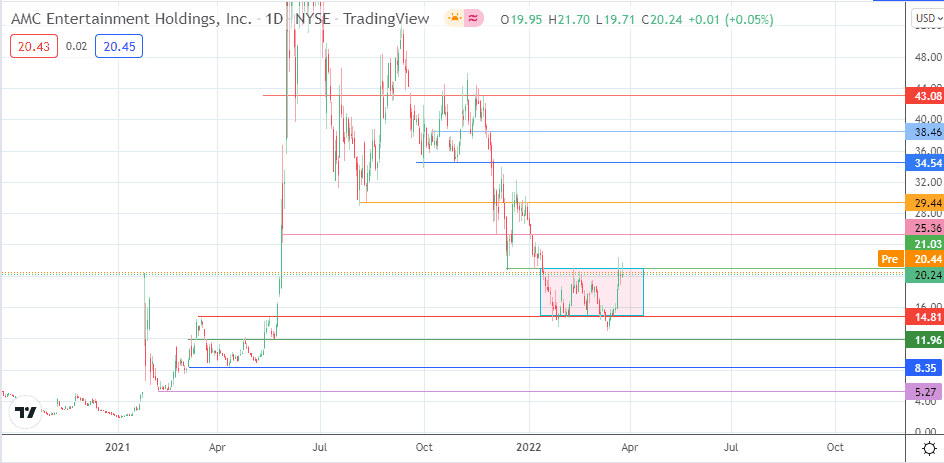
The latest uptick has stalled at a resistance level that marks the ceiling of a rectangle pattern. Given that the prevailing trend that preceded the rectangle pattern was a downtrend, the pattern is expected to resolve with a bearish continuation.
This would be in keeping with recent AMC stock forecasts from institutional investors, with seven analysts providing an “Underperform” rating and a 12-month price target of 10.45. This gives a potential downside of 48.3%. It also coincides with the size of the measured move from the 29.44 resistance level.
AMC Stock Forecast
The price activity is now testing the resistance level at 20.24. Only a clear 3% penetration close above this resistance level confirms the breakout, targeting 25.36 as the initial upside target. Additional barriers are seen at 29.44 (11 August 2021 low and 31 December 2021 high). A further extension of the upside move carries the AMC price to the 34.54 price mark (29 October 2021 low).
On the other hand, a rejection at the 20.24 resistance allows the bears to initiate a pullback move towards the opposite border of the rectangle, with 17.19 serving as an immediate barrier to this downside push. Only if the bears take out this barrier and the rectangle’s floor at 14.81 will there be a breakdown of the rectangle. This would allow for a potential decline towards the 20 May 2021 low at 11.96, with additional lows seen at 8.35 (12 April 2021 low) and 5.27 (19 February 2021 low).
AMC: Daily Chart