AAVE price hit a major resistance on January 17 despite positive developments in the ecosystem. After soaring to the year-to-date high of 91.11, AAVE/USDT retreated by about 10.7% to a low of $78.59. According to CMC, AAVE is one of the biggest DeFi token, with a market cap of over $1.1 billion.
Positive developments as TVL rises
AAVE has had two major positive developments in the past few weeks. First, like other players in the DeFi industry, AAVE has seen a significant increase of inflows in January. Data compiled by DeFI Llama shows that the network’s total value locked (TVL) has risen by more than 20% in the past 30 days to over $6.9 billion. This increase makes it the third-biggest DeFi platform in the world after Lido and Maker.
Another major development is that the developers launched AAVE Protocol V3 on Ethereum’s mainnet after months of testing. The new version of the dApp introduced more features, including higher composability and risks management tools. For example, admins can now set supply and borrow caps and have improved efficiency. AAVE V3 was already running on other protocols like Polygon, Arbitrum, and Avalanche.
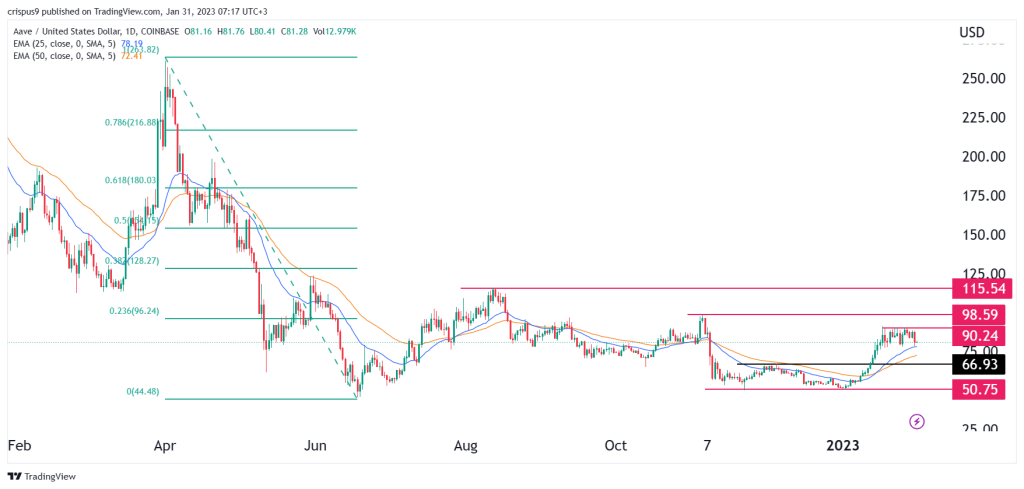
AAVE crypto price daily chart analysis
Turning to the daily chart, we see that the AAVE crypto price has been in a slow upward trend in after bottoming at $50 in December. As it rose, the token moved above the important resistance level at $67.86, the highest point on December 5. It also struggled to move above the key resistance at the 23.6% Fibonacci Retracement point at $96.25.
AAVE remains above the 25-day and 50-day moving averages. Also, it seems like it is forming a small bullish flag pattern, which is usually a bullish sign. Therefore, AAVE will likely have a bullish breakout as buyers target the important psychological level at $100. Further gains above this level will bring the key level at $115.5 to view.
This price is a few points above the crucial level at $98.58, which is the upper side of the cup and handle pattern. In price action analysis, this pattern is usually a sign of a bullish continuation However, a break below the support point at $75 will invalidate the bullish view.
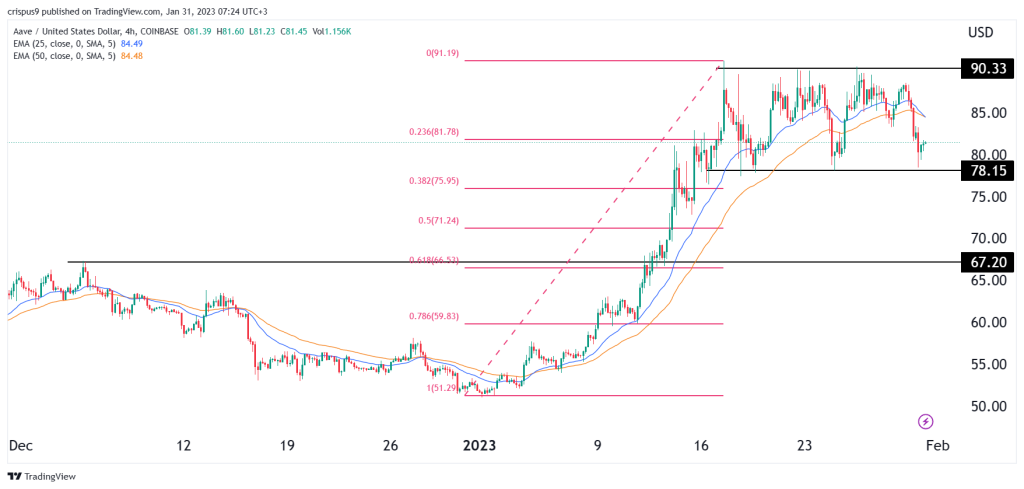
AAVE price 4H forecast
The 4H chart shows that the AAVE crypto price found a strong resistance level at $90.33, where it has struggled to move above in the past few days. It has also found a strong support at $78.15, where it failed to move below on January 18, 25, and 30. In this period, the coin has moved slightly below the 23.6% Fibonacci Retracement point while the 25-day and 50-day moving averages made a bearish crossover pattern.
Therefore, after forming a triple-top pattern, we can assume that the AAVE price will have a bearish breakout in the coming days. This view, however, will only be confirmed if the price moves below the support at $78.15. The stop-loss of this trade will be at $85.