

- What is the outlook of the Jersey Oil and Gas share price forecast? We explain what to expect now that the stock has risen.
The Jersey Oil and Gas share price has done well in the past few weeks as investors react to the positive comments by the company. It has also risen as investors cheer the relatively robust crude oil and gas prices. The JOG stock price is trading at 264p, which is its highest point since October 2017. It has moved upwards by over 470% from its lowest level in 2020, bringing its total market cap to over 86 million pounds.
Jersey Oil and Gas is a relatively small upstream oil and gas company with operations in the North Sea. The firm has been successful in aggregating significant resources in the Greater Buchan Area. As a result, it has control and flexibility to develop these resources. It has a two-pronged approach to develop its resource. For example, it is working to develop its principal assets and continue pursuing and executing asset purchases in the North Sea area.
The Jersey Oil and Gas share price is rising after the company said that its Greater Buchan Area was extremely strong. As a result, the company is engaged with a number of counterparties of scale. As a result, there is a likelihood that the firm will start producing later this year. Also, it has adequate funds with about 13 million pounds in cash. In a note, the CEO said:
The GBA is a high-quality, development-ready UK North Sea resource base of scale, and we look forward to concluding the farm-out process and moving into the next phase of activities.”

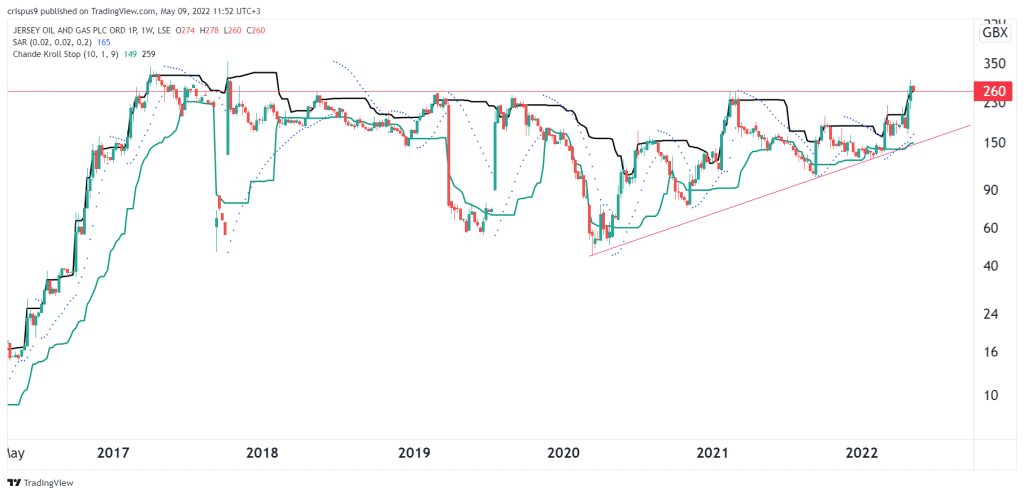
Jersey Oil and Gas share price forecast
The daily chart shows that the JOG share price has been in a strong bullish trend lately. A closer look shows that the stock has moved above the dots of the Parabolic SAR indicator. At the same time, the shares have formed an ascending triangle pattern that is shown in red. The stock is also along the upper side of the Chande Kroll Stop indicator shown in black.
Therefore, the stock will likely keep rising since an ascending triangle is usually a bullish sign. Therefore, the shares are on the cusp of a bullish breakout, with the next key level to watch being at 350p. Conversely, a drop below the support at 230p will send a signal that the bullish trend has eased.