- Our XRP price prediction would become extremely bearish in case of a daily closure below $0.30. Bears could target $0.22-$0.25 in near term.
The price is still trading in the same range as mentioned in our last XRP price prediction. Most of the price action within the past few months has been occurring in the $0.30-$0.40 trading range. Ripple XRP has immensely underperformed as compared to other top cryptocurrencies due to the ongoing SEC Vs Ripple lawsuit. Currently, it is the 7th biggest cryptocurrency by market cap and 90% down from its 2017 all-time high.
After a few weeks of positive price action, the crypto relief rally appears to be over. The brutal price rejections of BTC and ETH from critical zones have created panic among investors. Consequently, many analysts are predicting new lows across the whole asset class.
Currently, the XRP price is trading at $0.34. During Monday’s trading session, the price gained 2.17%. Due to the prevailing risk-off approach, most investors are sitting on the sidelines, awaiting a breakout. You can buy Ripple by signing up on the top crypto exchange Binance.
According to XRP news today, the flagship event Ripple Swell will be taking place from 16th to 17th November in London. During the 2-day event, attendees would be able to learn about the future of crypto, blockchain and cross-border payments.

XRP Price Prediction
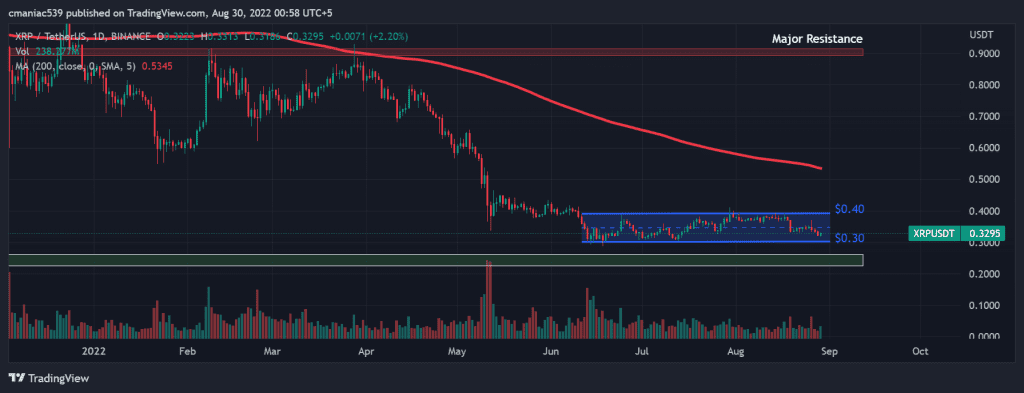
A look at the XRP USD price chart signifies a prolonged bearish accumulation phase. A breakout of the $0.30-0.4 range would trigger a massive move in that direction. Currently, the price is trading sideways, awaiting the next Bitcoin move. If BTC fails to stabilise above $20k, Ripple price is likely to retest the range lows at $0.29-$0.30.
Our XRP price prediction would become extremely bearish in case of a daily closure below $0.30. In such a bearish scenario, the next major support could be $0.22-$0.25 level which has been a historic demand zone. However, a break above $0.40 could generate enough momentum for the bulls to target the $0.55 level that lies around 200-day MA. If you plan to trade these breakouts, then don’t forget to use tight stop losses to avoid fakeouts.
Ripple Daily Chart