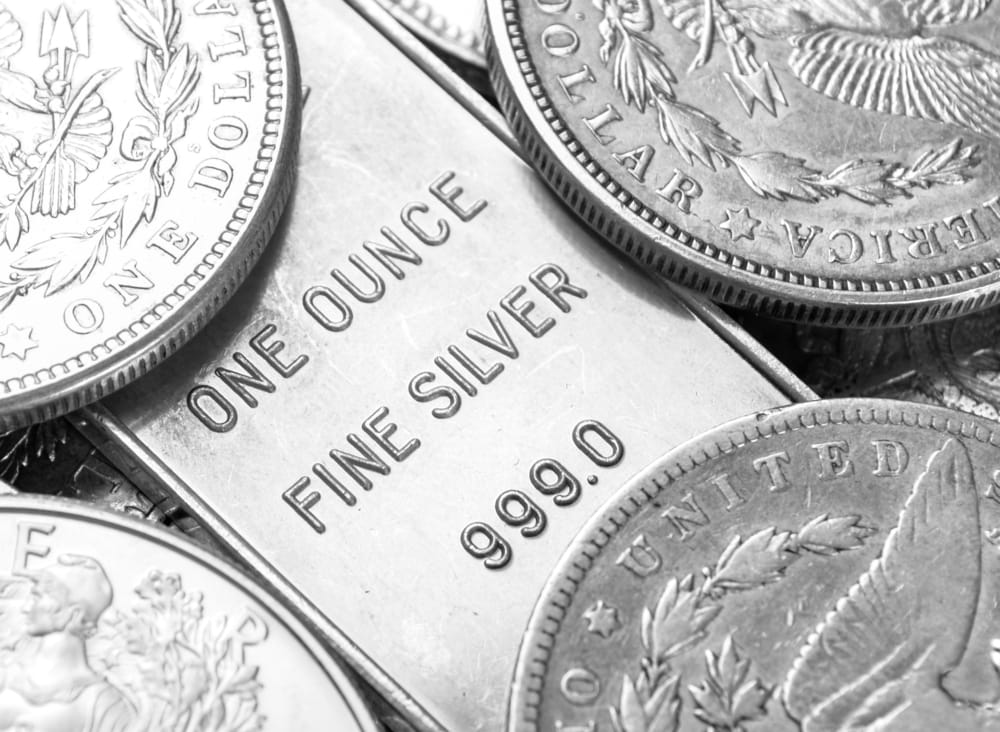
Silver price (XAGUSD) is ready for a breakout if the technical chart patterns and fundamental issues are to go by.
Silver fundamental analysis
For starters, silver is one of the cheapest precious metals you can trade today. A troy of the metal goes for about $15 while that of gold sells for about $1,700. Palladium, on the other hand, goes for about $1,800.
Silver is cheap for a reason. For one, unlike gold, silver is found in abundance. Indeed, the supply of silver is usually more than the demand. This tends to create a supply surplus, that tends to depress prices. According to the Silver Institute, the total silver supply in 2019 was about 1,023M ounces while demand was 991 million ounces. Including the recycled silver, this led to a surplus of more than 50 million ounces.
Another reason why silver is cheap is that the cost of producing it is relatively cheap. According to S&P Global, the average cost of producing an ounce of silver has been falling since 2012. This means that producers can ramp-up production, which is usually negative for silver price.
In addition, silver is different from gold because of its industrial nature. Most silver that is mined goes to manufacture jewelry and other household items. This is unlike gold, which is mostly used as an investment.
The opportunity for silver is that industrial demand is rising as economies reopen and supply could fall as mines close. Also, as I have written before, it seems like there is a lot of demand for silver from investors. These investors believe that silver price will rise as it did shortly after the past financial crisis
Download our Q2 Market Global Market Outlook
Silver price technical outlook
Let us now look at the silver price technical outlook. On the daily chart below, we see that the price of silver has been stuck between $14.50 and $15.80 in the past month. Also, we see that the metal formed a bullish flag during this consolidation. Most importantly, the price moved above the upper side of the flag on Friday.
Another observation is that the price is being supported by the 50-day EMA, which is also slightly above the 50% Fibonacci retracement level. Therefore, there is a possibility that bulls will attempt to push silver price to the 100-day EMA at about $16.00.
On the flip side, a move below $14.73 will invalidate this thesis. It will indicate that there are sellers in the market, who will be keen to push the XAGUSD price below the previous support of $14.50.

