
- The Vodafone share price is hovering near its lowest level since November 2020 as investors watch the company's progress.
The Vodafone share price is hovering near its lowest level since November 2020 as investors watch the company’s progress. The VOD stock is trading at 114.98p, which is about 17% below its highest level this year. This means that the shares are quickly moving to a bear market.
Vodafone growth steady
Vodafone is a leading telecommunication company that is best known for providing mobile services. The company offers its services around the world. It has operations in countries like the UK, where it competes with the likes of BT. It also offers services in countries like India, Germany, Kenya, and Tanzania.
Like most companies in the sector, Vodafone struggled during the pandemic because of a major slowdown in the lucrative roaming business. This slowdown was nonetheless offset by a big jump in data services as more people shifted to work from home.
At the same time, the company recorded strong demand for its fintech solutions. For example, M-Pesa users jumped to more than 50 million while its volume also rose. This trend could continue as Safaricom, the parent of M-pesa, negotiates a deal with the leading Kenyan utility providers.
The most recent results showed that Vodafone revenue jumped to more than 9.93 billion in the first quarter, which was a 3.1% increase from the same period last year.

The Vodafone share price has weakened because of the significant challenges it is facing in India, where Vodafone Idea is facing going concern challenges. The company has been losing market share as competition from Reliance Jio and Bharti Airtel rise.
Vodafone share price forecast
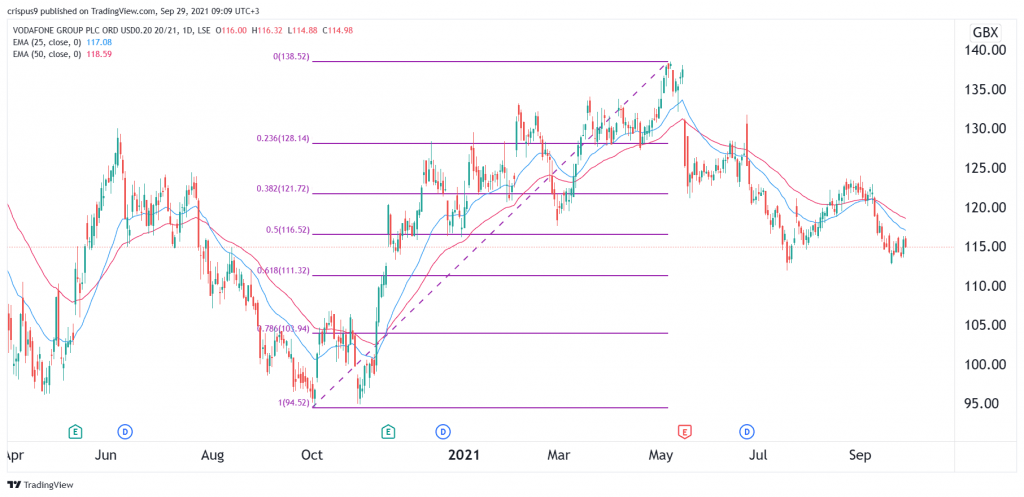
The daily chart shows that the VOD share price has been in a major sell-off lately. It has formed a head and shoulders pattern and moved below the 25-day and 50-day exponential moving averages (EMA). The head and shoulders pattern is usually a bearish signal. It has also moved slightly below the 50% Fibonacci retracement level.
Therefore, the stock will likely keep falling as bears target the next support at 110p, which is along the 61.8% Fibonacci retracement level.