

- The break of the symmetrical triangle will determine the direction of the VeChain price predictions going forward.
The emergence of a symmetrical triangle on the 4-hour chart of the VET/USDT pair has created an unclear situation as far as VeChain price predictions are concerned. The trend that precedes the pattern is a downtrend, which gives a bearish bias to these VeChain price predictions. However, there is always a chance that the pattern could lead to a reversal, which is why the triangle’s resolution is key to the eventual price direction of the VeChain token.
The price direction of the VET/USDT pair has remained a function of the general direction of the top cryptos. The pair currently lacks potent fundamental triggers, which gives the technical patterns greater potency as far as future price action is concerned. In August, the FOB Consensus update on the VeChain Public Thor Testnet went live, but this event did not trigger any serious price changes worth trading.
The Merge upgrade on Ethereum has dominated the headlines in the last two weeks. That upgrade is to be concluded today. Perhaps there will be more tradable activity on the VET/USDT pair in the days ahead, especially if the price action within the triangle approaches the convergence point of its borders.

VeChain Price Prediction
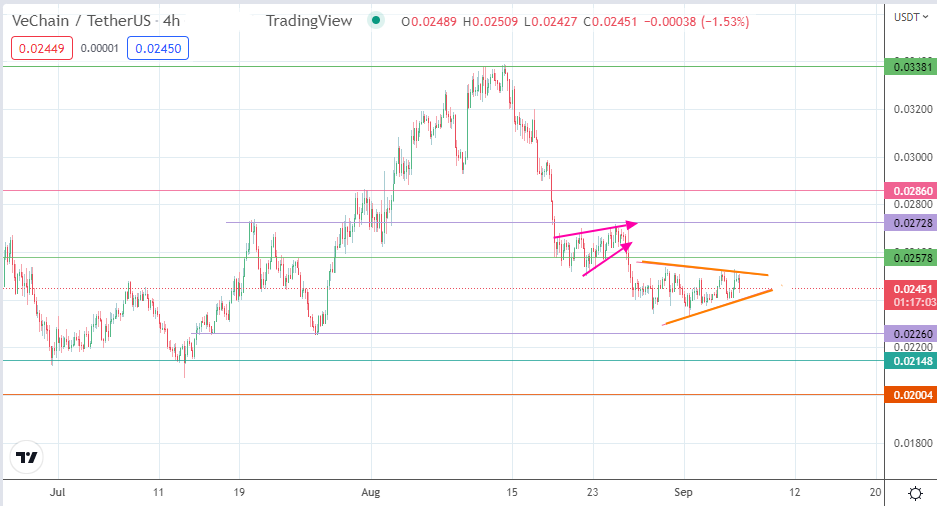
The resolution of the rising wedge led to the downside move that now constitutes the symmetrical triangle’s base on the 4-hour chart. The bears rebuffed the test of the triangle’s upper border earlier in the session. If the bears break down the pattern, the 0.02260 support level (16 July and 26 July 2022 lows) becomes the immediate downside target. A breakdown of this pivot brings in 0.02148. This price point is the completion point of the triangle’s measured move. 0.02004 only enters the mix as another downside target if the bulls fail to defend 0.02148.
Conversely, any advance in price action must follow a break of the triangle’s upper border. 0.02578 (19 August and 24 August lows) emerges instantly as the barrier between the bulls and the 0.02728 resistance target (26 August high). If the bulls uncap this barrier, 0.02860 enters the picture as another northbound target (31 July high).
VET/USDT: Daily Chart