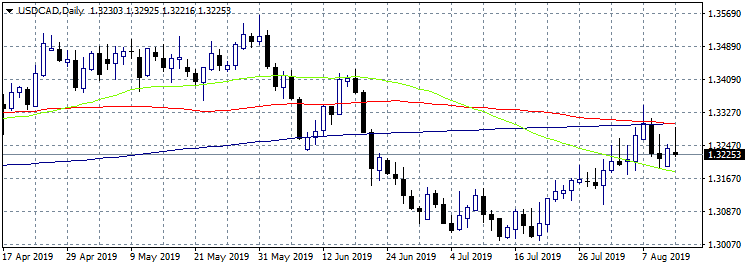
USDCAD trades 0.02% lower at 1.3227 as the pair looks trapped between the 50 and 100 day moving averages. The momentum is positive for the pair, having the daily high at 1.3292 just and the daily low at 1.3221. United States Consumer Price Index (YoY) came in at 1.8%, topping forecasts of 1.7% in July, while the United States Redbook Index (YoY) dipped from previous 5.1% to 4.4% in August 9. Crude oil, Canada’s main export product is 2.57% at $56.34 per barrel. The USD index is trading lower as the US trading session takes shape.
Bulls and bears fighting to take control of the short term trend as the pair trades above and below the hourly moving averages. Today the pair was trading above the all the major hourly moving averages but after the CPI the pair dived below the hourly moving averages. On the downside first support stands at 1.3221 today’s low and then at 1.3104 the low from July 30. Immediate resistance for the pair stands at 1.3292 today’s high, and then at 1.3313 the high from August 8th. Long positions are probably safe as long as the pair trades above the 1.32 mark.Don’t miss a beat! Follow us on Telegram and Twitter.
Download our latest quarterly market outlook for our longer-term trade ideas.
Do you enjoy reading our updates? Become a member today and access all restricted content. It is free to join.