The USD/ZAR is trading higher this Wednesday, but this is more of a follow-up action from yesterday’s positive data from the US end of the equation. Wednesday brought two sets of economic data that left the pair unchanged from the session’s earlier gains.
From South Africa, the trade balance data from the South African Revenue Services indicate that the balance of trade came in slightly lower than expected, registering at 24.76 billion rands versus the consensus of 25.50 billion rands. This figure was only slightly higher than the previous month’s reading. In the US, private sector employment data from Automated Data Processing (ADP) Inc. showed that 132,000 jobs were added to the US private sector in August, slightly higher than the 128K jobs added in July. This figure was far below the expected number of job additions, which stood at 300K.
The relatively dismal private sector jobs data has capped the gains of the USD/ZAR at a critical resistance point, but the pair remains 0.54% higher on the day. The USD/ZAR will look to other data to be released later in the week, namely the US ISM Manufacturing PMI and the Non-Farm Payrolls report. Friday’s NFP data will clarify whether the raised bets of a 75 bps rate hike by the US Federal Reserve on 21 September holds water.
USD/ZAR Forecast
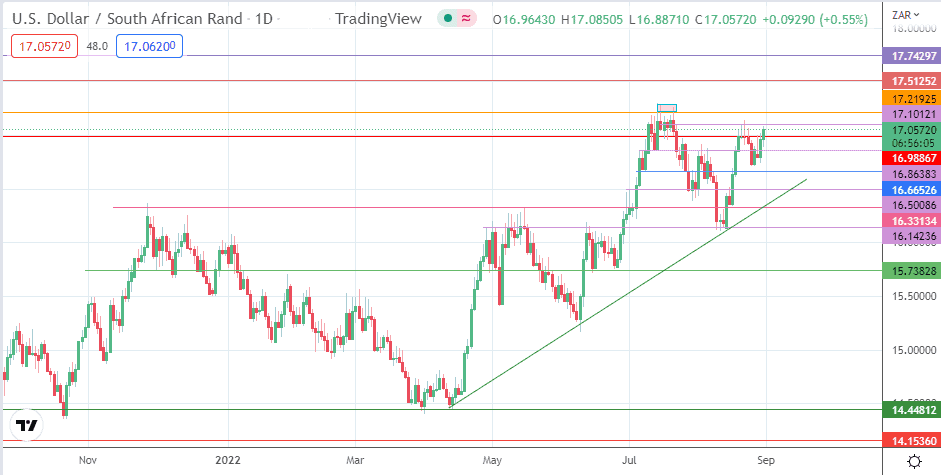
The 17.10121 price mark (22 August high) remains the price cap for the week. The bulls need an additional trigger to break this level for the 17.21925 () resistance to become a valid new target. A break of this level extends the uptrend, targeting 17.51252 (17 June and 18 August 2020 peaks). 17.74297 is the next target in line, which was formed by the 11 August 2020 top.
On the flip side, rejection at 17.10121 and a subsequent pullback sets up a potential evolving double top. If this is the case, the bears need to force a breakdown of the 16.66526 support (9/17 August 2022 highs) to complete the pattern. This scenario sets up 16.50086 as the completion point of the pattern’s measured move. Any further decline would depend on a breakdown of the ascending trendline and the 16.33134 pivot, targeting the 16.14236 (28 April and 12 August lows) support. 15.73828 (29 April and 15 June lows) only becomes a valid target if the corrective decline is more extensive.
USD/ZAR: Daily Chart