

- The USD/RUB exchange rate has been in a consolidation phase in the past few months. We explain what to expect in the coming days.
The USD/RUB exchange rate has been in a consolidation phase in the past few weeks. After rising to a year-to-date high of 75.09 on December 30, the pair pulled back to the current level of 69.50. This price is significantly below last year’s high of 153, meaning that the Russian ruble has done well during the war in Ukraine. It is also a few percentage points above last year’s low of 51.29.
The USD/RUB is reacting to numerous catalysts. The Russian economy seems to be doing better than expected amid the crisis in Ukraine because of the elevated oil prices. Brent and WTI prices have remained above $80 in the past few months. That has helped to maintain the Russian urals above the breakeven point of about $52. Recently, however, the country has faced headwinds as natural gas prices have pulled back because of the warmer winter and rising LNG exports to Europe.
The next important catalyst for the USD/RUB price is next week’s Fed decision which is expected to set the tone for the year. In it, the committee will deliberate on the state of the American economy and make its decision. The base case is where the bank decides to hike interest rates by 0.50% for the second straight meeting. To prevent the ongoing irrational exuberance, the bank will likely warn that it will hold rates higher for a longer period. In the past, however, actions of the Fed have had no major impact on the USDRUB price.
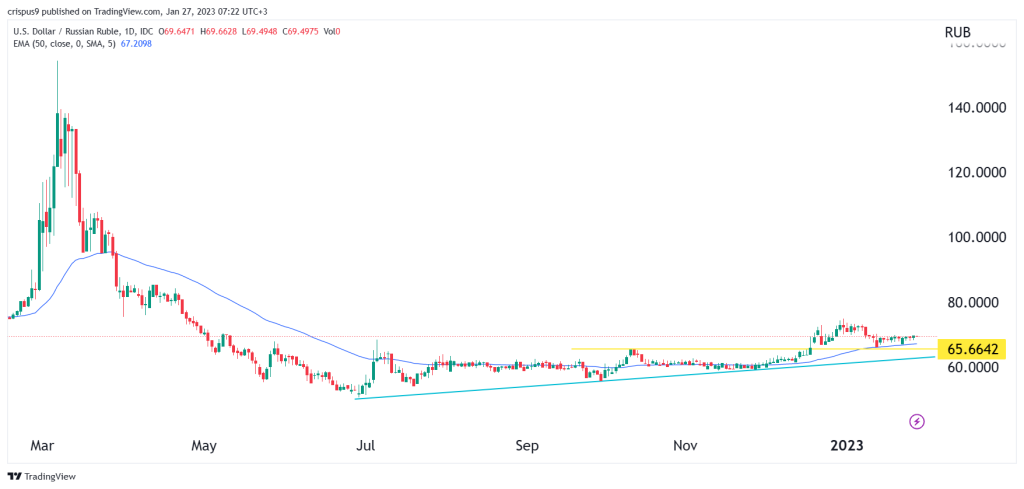
USD/RUB daily chart analysis
The 1D chart shows that the USD to RUB price surged after Russia invaded Ukraine. It then plunged like a stone after Russia unveiled policies to stem the sell-off, including substantial rate hikes and currency control measures. Most recently, we see that the USD/RUB has been drifting upwards, albeit at a slower pace.

During this period, it moved above the ascending trendline shown in green. Also, it rose above the important resistance point at 65.66, the highest point on October 12. Volume remains substantially low while the price is above the 50-day moving average. Therefore, there is a likelihood that it will remain in this range for a while. In the longer term, a bullish breakout to about 80 cannot be ruled out.
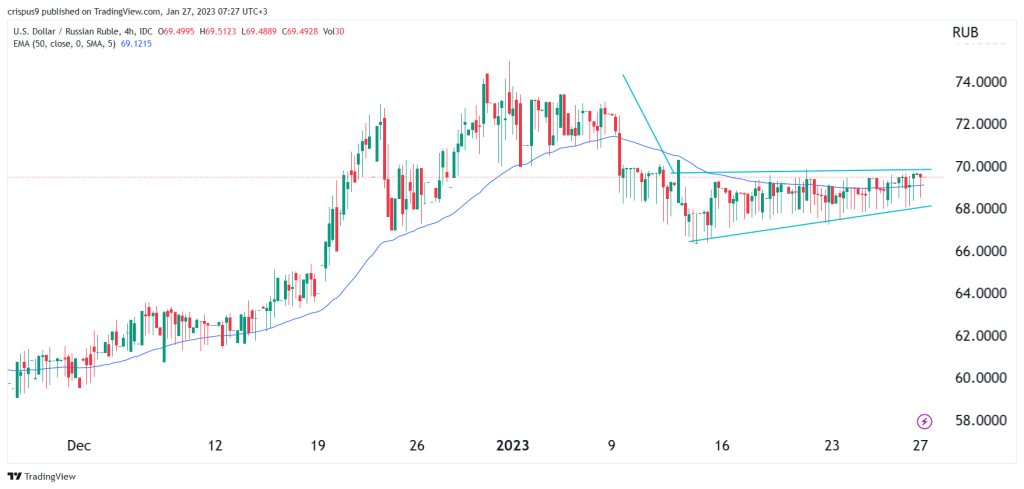
USD/RUB 4H chart analysis
The 4H chart shows that the USD/RUB exchange rate has been moving sideways in extremely low volumes in the past few days. It has formed a horizontal channel that is shown in green. This channel seems like an extended bearish pennant pattern. It is also consolidating at the 50-period moving average while the Average True Range (ATR) has moved slightly lower. Therefore, the pair will likely have a bearish breakout in the coming weeks and move to the support at 60.