
- The USD/INR has a good potential of hitting new record highs if the Fed delivers on a 100 bps rate hike on Wednesday.
The USD/INR pair is marginally higher this Monday on a trading day marked by low volume trading as investors await Wednesday’s make-or-break FOMC interest rate decision. Last week’s CPI data out of the US has changed the dynamics of this upcoming rate decision, with bets of 100 basis points rate hike clearly on the up.
The Rupee has been helped in recent weeks by intervention from the Reserve Bank of India, keeping the pair in a narrow range in the last two months. This could change on Wednesday if the FOMC delivers the 100 bps rate hike.
Also on the watchlist of traders on Wednesday is the so-called dot plot. The FOMC Chief Jerome Powell gives his commentary thirty minutes after the numbers hit the market. His comments may provide the Fed’s inflation forecast and the trajectory it will take to achieve this forecast if any.
With very few fundamental triggers for the Rupee, it all boils down to what happens on Wednesday. The chart pattern favours a surge into new record territory if a new round of buying takes the USD/INR above the 80.21 14 July record high. The USD/INR forecast paints the picture below.
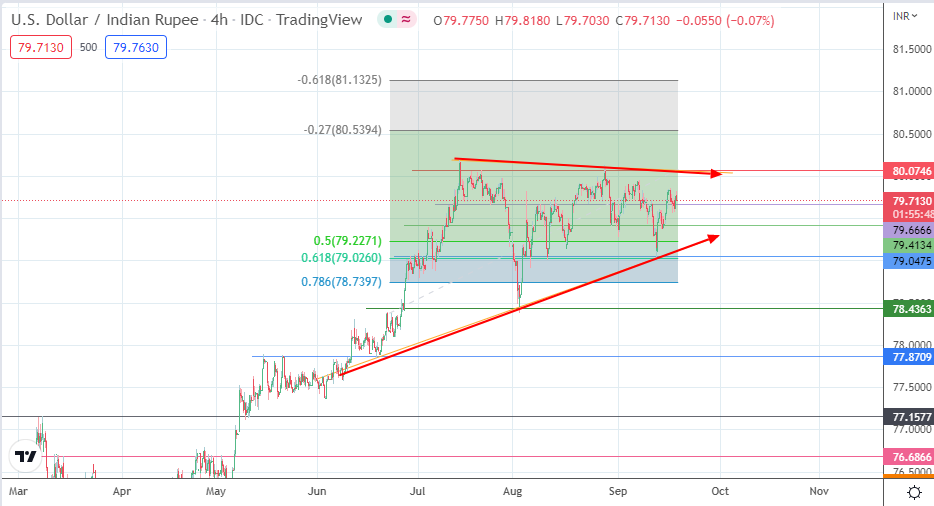
USD/INR Forecast
The 79.6666 pivot remains the intraday support for price action. A bounce from this level targets the 80.0746 resistance. This is the barrier to beat for the USD/INR to push into new record territory. A break of this barrier completes the triangle, clearing the route for a potential push toward the 61.8% Fibonacci extension of the 22 June swing low to the 29 August swing high, located at 81.1325.

Before attaining this price point, the bulls must surpass the 27% Fibonacci extension at 80.5394, which is the likely immediate target once the USD/INR breaks above the 14 July prior high at 80.2100. On the other hand, a breakdown of the 79.6666 price mark brings 79.4134 into the mix as the corrective decline’s initial downside target.
Below this pivot, 79.0475 forms another downside pivot that intersects the triangle’s lower border, formed by the 10 August and 13 September 2022 lows. 78.4363 (28 June and 2 August 2022 lows) becomes a harvest point if the triangle’s lower border breaks down. 77.8709 (20 June low) lies below this target point.
USD/INR: 4-hour Chart