- The USD/INR pair is slightly higher, but any long-term uptrend continuation will depend on a break of 80.07.
Asian currencies including the Indian Rupee and Chinese Yuan weakened against the greenback on Monday, keeping the USD/INR slightly in a bid to extend the winning run of the pair into the third trading session. However, the ascent of the USD/INR appears limited on market talk of a possible intervention by the Reserve Bank of India.
Economists at Equirius have opined that RBI action is likely, which will support the Rupee in the short term even as India’s equity and money markets see moderate foreign portfolio investments. The Rupee appears to have fared better than its peers, especially the Yuan, which is set to touch off 2-year lows as China begins another round of severe restrictions due to a new COVID-19 outbreak.
The recent tops at the 80 rupee mark appear to be the key resistance level for the bulls to attack. This price point forms the rate-limiting point, which could usher in new highs if the bulls are able to breach these levels. The FOMC decision of 21 September could provide the fundamentals for a key test of this level.

USD/INR Forecast
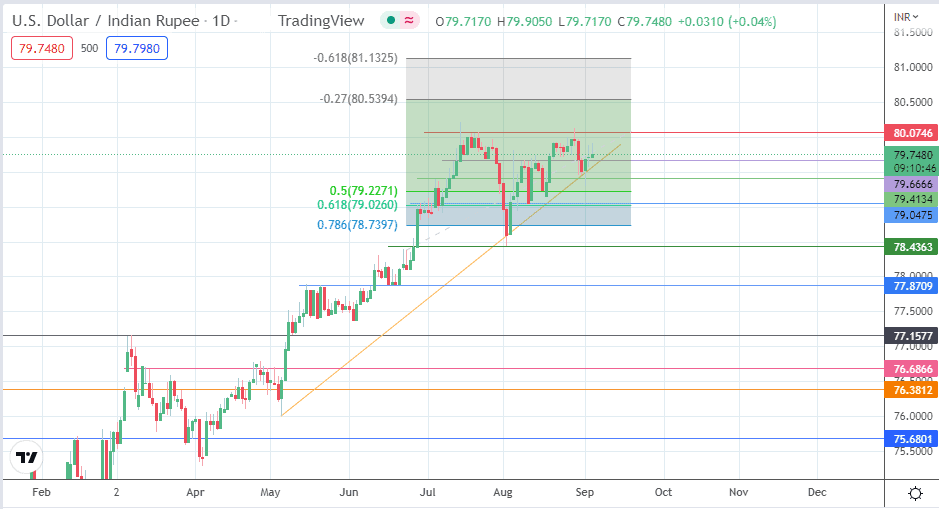
The bounce on the double support provided by the 79.6666 price mark (12 June and 10 August highs in role reversal) and the ascending trendline provide a pathway for the bulls to challenge the 80.0746 resistance once more. A break of these 19/21 July 2022 highs sends the pair to new record highs. This throws up 80.5394 (27% Fibonacci extension) as the immediate target, followed by the 81.1325 resistance formed by the 61.8% Fibonacci extension level.
Conversely, a breakdown of the 79.6666 support/ascending trendline support negates the upside outlook. The 79.4134 support (12 July lows) comes into the picture as the next target, followed by 79.0475 (10 August low). This support lies close to the 61.8% Fibonacci retracement level. If this level is degraded, the 2 August low at 78.4364 and 77.8709 (21 June low) form additional targets to the downside.
USD/INR: Daily Chart