

- The Graph price has plummeted sharply in the past few days. We explain whether GRT is still a good long-term investment.
The Graph price has plummeted as the ongoing cryptocurrency sell-off gathers momentum. GRT, the network’s native token, retreated to a low of $0.1400, which was the lowest level since December 2020. This means that it has declined by over 95% from its all-time high. The decline happened as Bitcoin moved below $29,000 for the first time, and the Terra LUNA price was nosedived.
Risk assets are crashing.
A closer look at the broader financial market shows that investors have been dumping risky assets at a faster pace in the past few months. Cryptocurrencies, which are considered riskier than other assets, have been worse off than most other assets like stocks.
Still, many growth stocks have all dropped sharply in the past few months. For example, Canoo stock price dropped sharply after the company said that it could run out of money. Similarly, most Ark Innovation Fund stocks have fallen by more than 60% from their all-time highs. The same is true for stocks like Teladoc and Coinbase.
The Graph price has not been left behind in this sell-off. The coin has dropped to the lowest level since 2020 as investors continue worrying about the blockchain industry. In addition, the collapse of Terra UST has led to risks of contagion in the broader sector. This is notable since Most developers widely use the Graph in the industry. Therefore, if the sector declines, there is a high probability that it too will keep falling.

The Graph price prediction
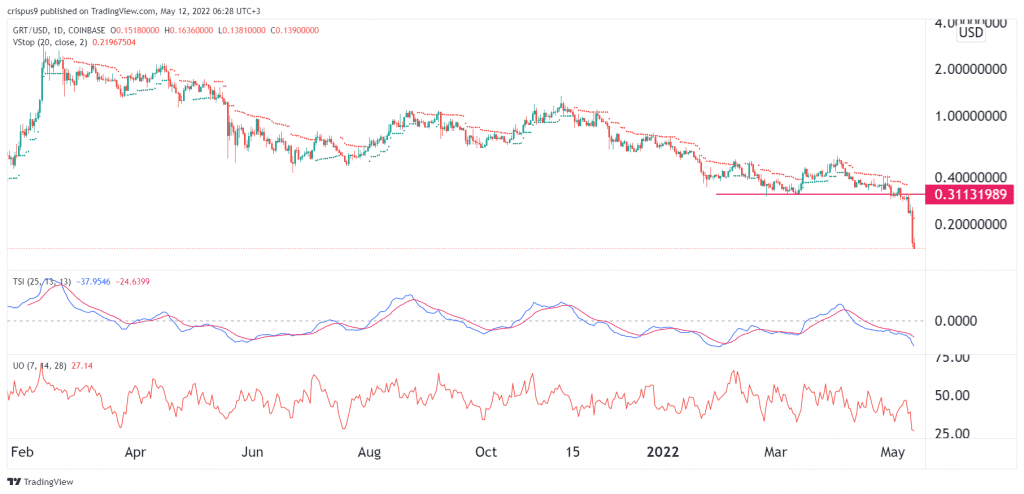
The GRT price has been in a spectacular decline in the past few months. However, this week, it managed to move below the important support level at $0.311, where it had struggled to move below earlier this year. This was a sign that bears were getting more confidence. At the same time, the coin’s price has crashed below the volatility stop indicator, while the True Strength Indicator (TSI) and the Ultimate Oscillators have kept falling.
Therefore, the outlook of The Graph price is still weak as sentiment in the sector worsens. Therefore, the next key reference level will be $0.1200. The stop-loss for this trade will be at $0.20. This view is in line with my long-term forecast for The Graph.