- The SP 500 index continues to sell off in response to the Fed's 75 bps rate hike and the more hawkish than expected dot plot.
The S&P 500 index is on course for the 3rd day of losses following the 75 basis points rate hike by the US Federal Reserve at the end of its 2-day meeting on Wednesday. The S&P 500 slumped 1.71% to close the day with its largest single-day loss since 13 September. Market action remains bearish, with the S&P 500 index down 1.05% this Thursday.
Rate hikes break the deal for stock traders, making bonds more attractive and more expensive to borrow money to trade stocks. Also serving to push the index lower is the Fed’s so-called “dot plot” which turned out more hawkish than expected. The Fed expects inflation to be a problem well into 2023 and they are going to do what they can to keep it within the target.
The markets shifted to the jobless claims data for the week under review. Due to the downward revision of the previous number to 208K from 213K, the actual number of 213K can be considered a sign that progress has not been made in the US labor market in filling vacancies. This could strengthen the Fed’s resolve to aggressively push its dot plot agenda.
Goldman Sachs and several investment banks have adjusted their interest rate expectations. Goldman now calls for another 75 bps rate hike in November, 50 bps in December and 25 bps in February 2023, allowing for rates to peak at 4.75% in February 2023.
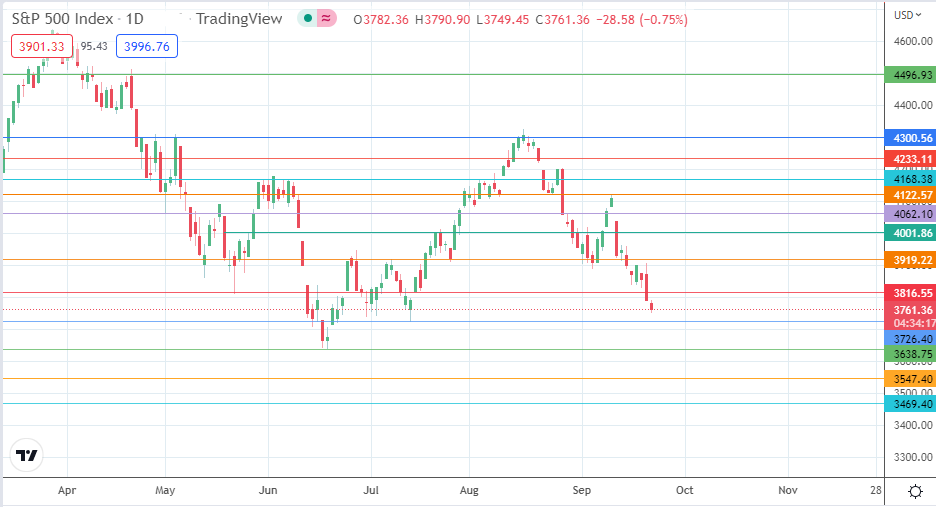
S&P 500 Index Forecast
The decline is headed for the 3726 support level (14 July 2022 low), having taken out the previous support at 3816 (20 May 2022 low).

If the bulls fail to defend this new pivot, the push towards the 17 June 2022 low at 3638 will be on the cards. Below this level, the 3547 (9 November 2020 low) and 3469 (22 October 2020 high in role reversal) become the additional targets to the south on continued price deterioration.
Conversely, the bulls need to arrest the slump by defending the 3726 support. If this happens, the accompanying bounce targets 3816, now acting as a resistance. A break of this resistance opens the door toward the 3919 barrier (26 July and 14 September 2022 lows). Above this level, there is a psychological resistance at 4001 (21 July high), followed by the 4062 (29 August high) and 4122 (12 September high) price marks, which constitute new harvest points for the bulls if the advance move is extensive.
SP500: Daily Chart