

- S&P 500 index has come under fire in the past few weeks as concerns about earnings and the super red hot US dollar.
S&P 500 index has come under fire in the past few weeks as concerns about earnings and the super red hot US dollar. The index slipped to a low of $3,627, which was the lowest level since November 2020. It has dropped by more than 24% from the highest level this year. The Dow Jones and Nasdaq 100 indices have also slipped.
US dollar index (DXY) is a major risk
The S&P 500 index has been in a sharp downward trend in the past few weeks as concerns about the American economy continues. For example, US bond yields have surged to the highest level in years, with the 10-year rising to 4% this week, The 2-year yield has risen to the highest point in more than 14 years.
One of the biggest risks for the S&P 500 index is the red hot US dollar. The US dollar index has surged by more than 20% this year and analysts believe that it will continue soaring in the coming weeks. This strength has mixed outcomes for America’s publicly traded companies. Some domestic firms that do a lot of imports are benefiting. The same is true for energy companies like Exxon and Chevron that sell in US dollar.
However, many big companies that have the biggest weighting in the S&P 500 will be hit as the US dollar index surges. For example, Apple unveiled its next devices this month and the company maintained their prices.
However, internationally, its products have surged by more than 20% because of the strong US dollar. Therefore, there is a likelihood that the company’s growth will be hit. The same is true for other tech giants like Microsoft, Adobe, and Cisco.

Therefore, analysts expect that corporate earnings will have significantly slow growth in Q3 and Q4. According to FactSet, the estimated earnings growth rate for the S&P 500 is 3.2%, which is the lowest figure since Q3 of 2020.
S&P 500 index forecast
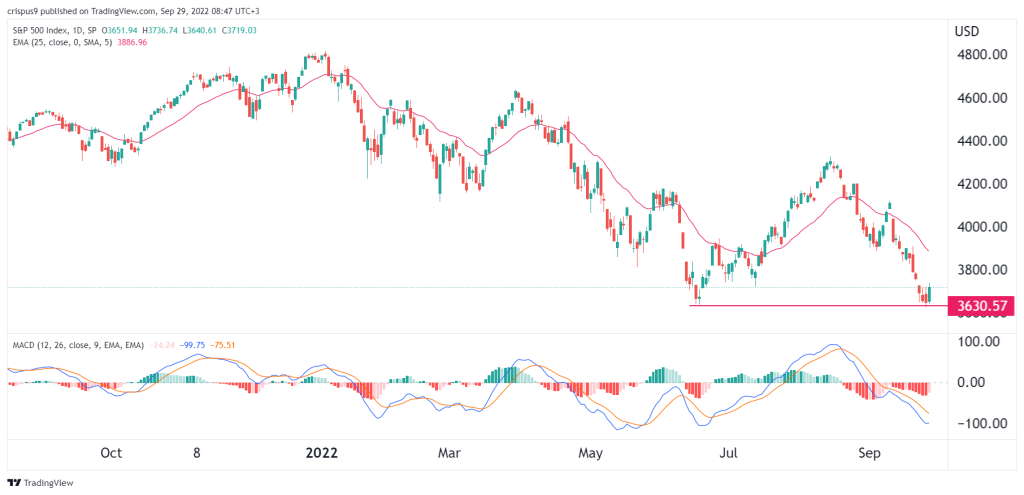
The daily chart shows that the S&P 500 index has been in a strong bearish trend in the past few months. It fell to a low of $3,630, which was the lowest point in June. The index seems to have formed a double-bottom pattern, which is usually a bullish sign. At the same time, it has moved below all moving averages while the MACD has crashed.
Therefore, a drop below the support at $3,630 will mean that bears have prevailed. As such, it will open the possibility of the index falling to the next support at $3,500. A move above the resistance at $3,800 will invalidate the bearish view.