
- The Solana price prediction is derived from the bullish pennant pattern on the daily chart, which points to a potential to hit $243.
The price pattern on the daily chart gives room for a bullish Solana price prediction if the price action can surmount a primary price barrier.
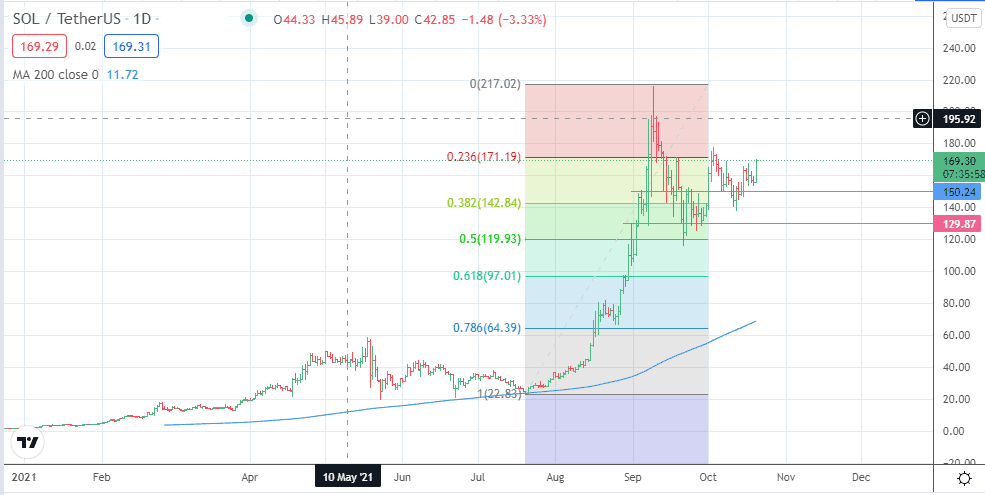
Following the decline from the all-time high at $216 in early September, the SOL/USDT pair has consolidated in a potential bullish pennant pattern, with price now testing the upper limit of this pattern.
The recent approval of two Bitcoin ETFs by the US Securities and Exchange Commission (SEC) has generated fresh demand in the crypto market, sending BTC to new all-time highs. This has sparked some bullishness on several cryptos.
A break of the pennant pattern could send Solana to new highs. The price projection of the measured move from this pattern stands at $246. However, any move towards this area requires the bulls to take out some potential resistance marks defined by the Fibonacci retracement tool.
Solana presently trades 11% higher as of writing.

Solana Price Prediction
The impending breakout of the bullish pennant has to contend with the resistance at the 171.19 price mark (23.6% Fibonacci retracement from the swing low of 19 July to the swing high of 9 September). A break above this level opens the gates for the bulls to march towards 197.52 initially, before the all-time high at 216.00 becomes available.
On the other hand, a breakdown of the 150.24 support puts the pattern in jeopardy. This move may follow rejection and a pullback from the 171.19 resistance. If a corrective decline occurs and 129.87 is attained, the pennant becomes invalid. At this time, 119.93 (50% Fibonacci retracement) and 97.01 (61.8% Fibonacci retracement) become the price targets to the south.
Solana (SOL/USDT): Daily Chart
Follow Eno on Twitter.