- The Solana price prediction is for the SOL/USDT to dip further in the weeks ahead as the chart patterns turn bearish.
The SOL/USDT daily chart price picture could make way for bearish Solana price predictions to flood the market. This is because the recovery move appears to have stalled at the recent demand zone bordered by the 46.94 price mark and the 48.79 price barrier.
The double top has occurred within the context of the bearish flag consolidation, with the top initiating a downward march that could culminate in the pattern’s breakdown. Despite the 0.5% upside seen in the SOL/USDT pair, the bullish momentum seen last week appears to have waned. This could leave the pair vulnerable in the days ahead.
The Solana price predictions are turning negative after a Q1 report by Messari pointed out the decline in Solana’s transaction volumes due to rising network security concerns. Solana’s 2022 performance appears to have paled significantly compared to 2021’s massive growth.
Transaction volumes are down 17%, and revenue has almost halved, despite an uptick in the active user base. The number of active developers has also declined considerably, nearly half the number at the time of Solana’s November 2021 peak. The SOL/USDT pair is up 0.24% on the day, but this has in no way erased Sunday’s 3.4% loss.
Solana Price Prediction
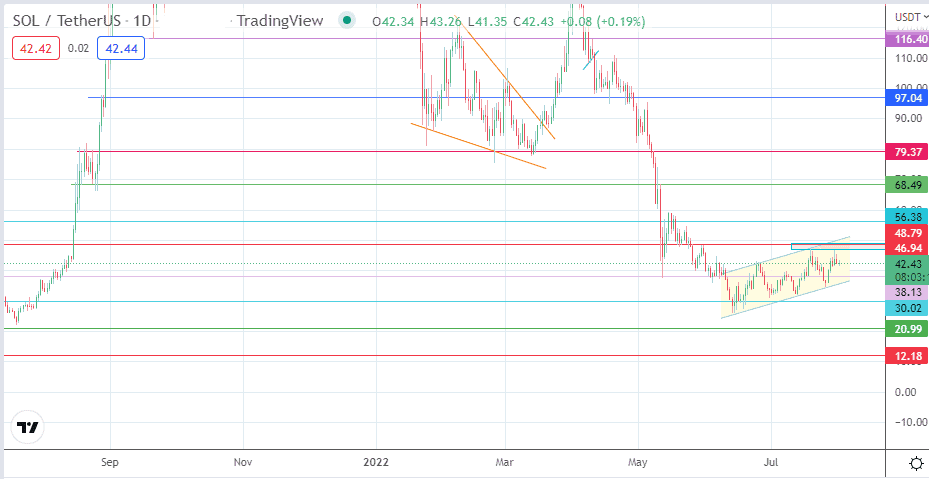
The emerging bearish flag on the daily chart points to a further decline in the SOL/USDT pair, targeting the completion of the measured move at 12.18 (28 February and 25 March 2022 lows). To attain this price mark, the bears must break down the support at 38.13 and take out sequential support levels at 30.02 (psychological support and 19 April low) and 20.99 (18 April and 21 June 2022 lows).

This move would also support the expected resolution of the double top 19 July and 30 July 2022. On the flip side, a break of the supply zone capped by the 48.79 resistance (25 April and 12 May highs) opens the way toward 56.38, where the 19 May 2021 and 13 May 2022 highs are found.
If the price action extends above this level, the 60.00 (18 August 2021 psychological low) and 68.49 resistance levels (16 August 2021 and 12 May 2022 highs) are the next targets for the bulls. 79.37 only becomes an additional harvest point if the 68.49 barrier gives way.
SOL/USDT: Daily Chart