

- What is the outlook of the SNDL stock after the company published strong results? We explain whether the shares are a buy.
Since March this year, Sundial Growers shares are still hovering near their lowest level after the company published strong results. The SNDL stock price is trading at $0.506, about 43% below the highest level since March. Other cannabis stocks like Tilray, GrowGeneration, and Curaleaf Holdings have also slumped.
Sundial Growers earnings review
Sundial Growers had a strong quarter as its revenue jumped to $17.72 million, which was 60% from the same point in 2021. This growth was mostly because of higher volumes and its acquisition. As a result, its adjusted EBITDA for the quarter rose to CAD 18.4 million, which was better than the previous loss of CAD 5.6 million. Its net loss for the financial year was CAD 230 million, which included a non-cash provision of CAD 155 million.
Meanwhile, its cultivation and production revenue rose to CAD 12.8 million in the quarter, while wholesale sales to licensed producers fell to 9.8 million. Further, the firm deployed over 578 million Canadian dollars, mainly to SunStream. Therefore, analysts expect that the company’s revenue will keep growing this year.
The SNDL stock price has declined recently as hopes for federal legalisation of marijuana in the United States faded. While the House of Representatives passed a bill to legalise Cannabis products, there are zero chances that the Senate will pass the law. The stock also declined after the revelation that the growth of its SpiritLeaf stores in Canada was slowing. The CEO attributed this to the volatility of the Canadian market.

SNDL stock price forecast
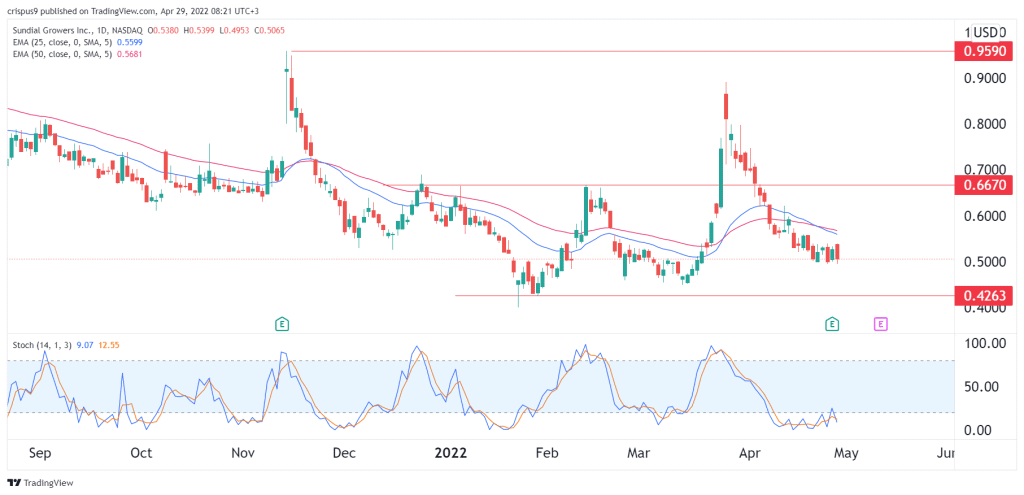
The daily chart shows that the SNDL share price has been in a strong downward trend in the past few weeks. The stock remains slightly below the 25-day and 50-day moving averages. It has also formed what looks like a head and shoulders pattern. In addition, the Stochastic Oscillator has moved to the oversold level.
It has also formed a bearish flag pattern. Therefore, the stock will likely have a bearish breakout in the near term. The next key support level will be at $0.4263, which was the lowest level on January 28th.