

- The Shiba Inu price prediction is for more investors to lose their shirts as the SHIB/USDT pair continues to plunge.
The breakdown of the 0.00003092 support line on the daily chart of SHIB/USDT adds more fuel to bearish Shiba Inu price predictions and would be a natural source of worry for holders of the token. Statistics from WhaleStats indicate that many whale wallets purchased the token at significantly higher prices, which would put most of those wallets in losing territory.
This has not stopped more whales from accumulating the asset. However, with prices retracing more than 70% from their 28 October all-time highs, one wonders whether the bottom will be found any time soon. Prices may well be on their way to the 17 October lows, which would put the 9% whale ownership under severe strain.
However, the earliest HODLers may not be overly worried. Those who bought in early October would still be in profit. The situation with Shiba Inu is another reminder to unsophisticated traders: never allow the FOMO feeling to drive you to buy at the top or near to the top.

Shiba Inu Price Prediction
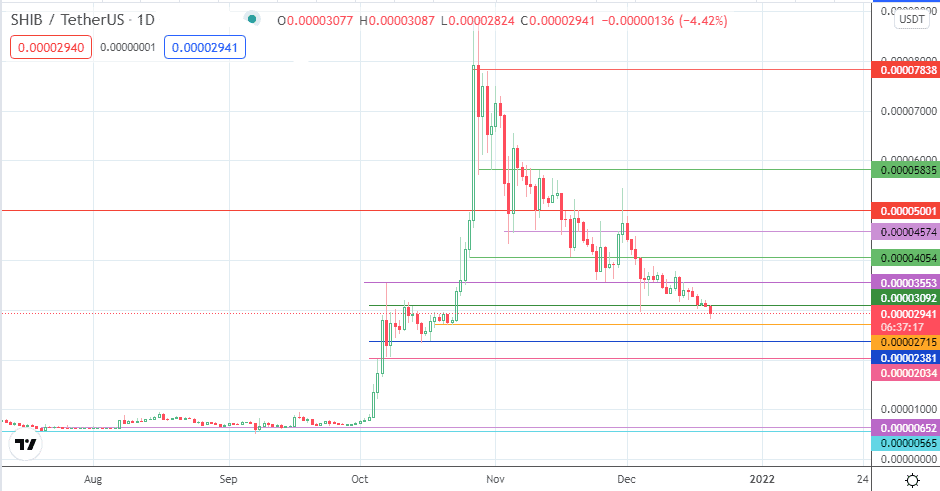
Sunday’s 2.04% decline violated the 0.00003092 support, while Monday’s lower close would confirm the breakdown of that support level. This move opens the door towards the 15/17 October lows at 0.00002381. However, the intraday move to the south caught a bounce just above the series of lows between 19-23 October at 0.00002715. This support level is integral to the survival of the bulls. Otherwise, the move south puts 0.00002381 support in jeopardy. If the bulls fail to defend this level, 0.00002034 returns as a potential pivot.
On the flip side, the bulls would be looking for a potential bounce off 0.00002715 or 0.00002381. Such a bounce would target a break of both 0.00003553 and 0.00004054. A break of the latter to the upside may allow for price discovery of the 0.00004574 or 0.00005001 price resistance levels. Only when the price advances above the latter and the 0.00005835 resistance can some positive momentum return to the asset. Otherwise, any rallies will constitute new selling opportunities for the bears.
SHIB/USDT: Daily Chart