

Summary:
- Suzlon experiences market volatility in 2025. Explore key support and resistance levels, recent news, and its future in renewable energy.
Suzlon Energy Ltd., a prominent player in India’s renewable energy sector, has recently experienced notable stock market fluctuations. On January 6, 2025, the company’s shares hit a 5% lower circuit, closing at ₹58.06, marking a significant decline over three consecutive sessions.
Suzlon Support Levels to Watch
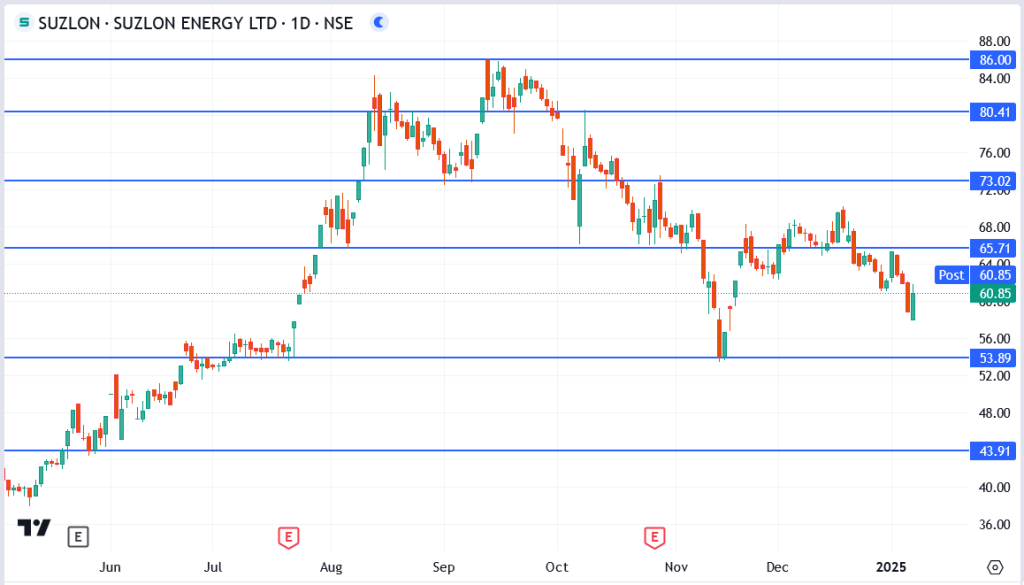
- ₹58.06:
This level, tested during the recent correction, represents an immediate support zone. A sustained hold above this level could prevent further downside and signal consolidation before the next move. - ₹53.89:
A crucial support level that marked a pivot during October 2024. Breaking below this level could lead to increased bearish sentiment, potentially driving the price lower toward ₹43.91. - ₹43.91:
The long-term support level from mid-2024. This level served as a base for the stock’s rally and represents a critical threshold for Suzlon’s bullish structure.

Suzlon Resistance Levels to Monitor
- ₹65.71:
The immediate resistance level and a psychological barrier. Suzlon has struggled to break above this zone in recent weeks, with multiple failed attempts. A breakout above ₹65.71 could attract fresh buying interest. - ₹73.02:
This resistance zone aligns with November’s highs and represents a medium-term hurdle. Clearing this level could indicate renewed bullish momentum. - ₹80.41:
A significant resistance from September 2024. This level marks the 52-week range and will require strong volume and fundamental triggers for a breakout. - ₹86.00:
The all-time high from September 2024 remains a key target for bullish traders. A break above this level could initiate a fresh uptrend, possibly leading to uncharted territory.
Conclusion
Suzlon Energy’s share price is navigating a crucial phase as it consolidates between ₹58 and ₹65. While the long-term trend remains bullish, investors should watch for confirmation of a breakout above ₹65.71 to target higher levels. Conversely, a break below ₹53.89 could indicate a deeper correction. Technical traders should combine these levels with market news and broader sector trends to make informed decisions.