
- In the past few months, Safemoon's price has become aggressively bearish. Since June 1, the crypto has dropped by over 50 per cent.
In the past few months, Safemoon’s price has become aggressively bearish. Since June 1, the crypto has dropped by over 50 per cent. In August, it is already down by 9 per cent, and the bear trend looks likely to continue.
However, despite the long-term bearish trend, the past few weeks have seen Safemoon price starting to trade sideways. Today, with Safemoon price going up by 2 per cent and extending yesterday’s 0.3 per cent gain, signals that the horizontal market is likely to continue for the next few trading sessions.
Part of the reason we have seen Safemoon trading in a horizontal market is due to the cooling off of traction. For instance, in the past 24 hours, the trading volume of the cryptocurrency has dropped by 38 per cent. The total volume traded during that time totalled $554,680.
In comparison, looking at data from August 11, when the total trading volume was about $1.8 million, it shows the volume has declined by more than 69 per cent. Such a lack of activity in the market normally results in a lacklustre market, which is what we are seeing today.
Safemooon Price Analysis
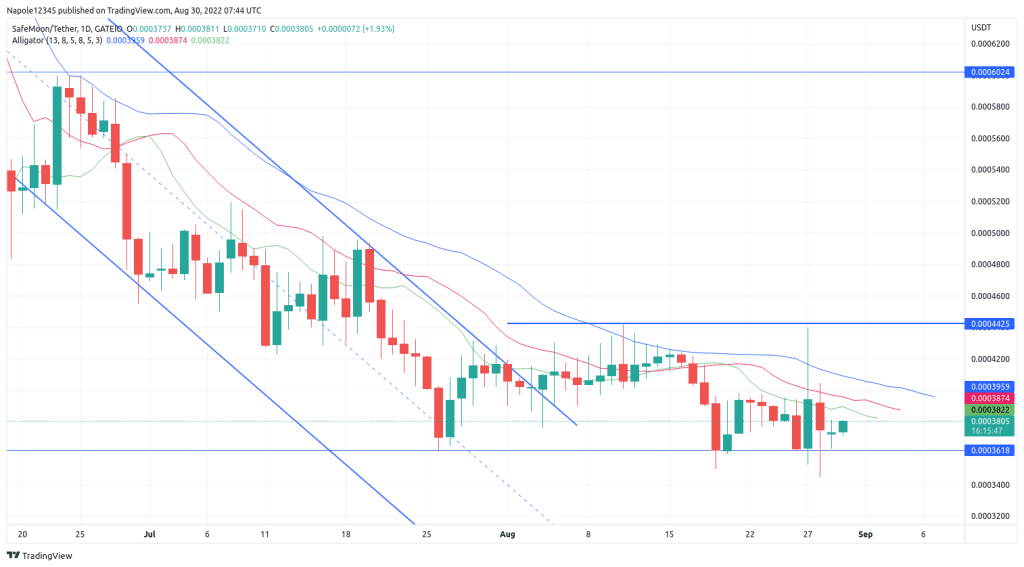
Looking at the daily price chart below, the current price gain will be a continuation of a sideways market that has lasted for weeks, when the prices have traded within the support and resistance levels of $0.00036 and 0.00044, respectively.

Therefore, I expect the current price gains to continue. However, there is a high likelihood that the prices will not hit the $0.00044 resistance level. Part of the reason why I think the sideways market will be long-term is due to the current cryptocurrency industry trend, which has seen its market capitalization seesawing around $1 trillion market capitalization.
With the industry struggling, altcoins such as Safecoin will also have a hard time recovering or starting their own trend because they are positively correlated. However, should the Safemoon price hit and move above the resistance level, my sideways market analysis will be invalidated. It will indicate a new long-term bullish trend has been established.
Safemoon Daily Chart