

- The Russell 2000 index slipped to the lowest level since October 25 as volatility rebounded. It dropped to a low of $1,760
The Russell 2000 index slipped to the lowest level since October 25 as volatility rebounded. It dropped to a low of $1,760, which was about 5.7% below the highest level this month. It has fallen by more than 20% this year. The VIX index has risen by more than 8.5% from the lowest level this month.
VIX index rebounds
The Russell 2000 index has pulled back in the past few days as investors focus on the midterm elections. Results published so far show that the highly anticipated Republican red wave failed to materialize. Historically, stocks tend to do well after the midterm elections because of the deadlock that ensues in Washington.
The index, which is made up of small and medium-sized companies, has pulled back because of the policies by the Federal Reserve. Last week, the Federal Reserve hiked interest rates by 0.75% and hinted that it will continue hiking rates in the next few months. The Fed also hinted that rates will remain at an elevated level for a while.
The strong US dollar has benefited many small companies that buy inputs from abroad. A strong USD makes it possible for these companies to import cheaply. This is in contrast to many large companies that have seen their earnings crash in dollar terms.
Meanwhile, the VIX index has pulled back slightly in the past few days. It has risen by about 8% from the lowest level this month. Still, it remains significantly below October’s high of $34.67. The index has also formed a double-top pattern, meaning that it will continue falling in the coming months. The Russell index has an inverse correlation with the VIX.

Russell 2000 index forecast
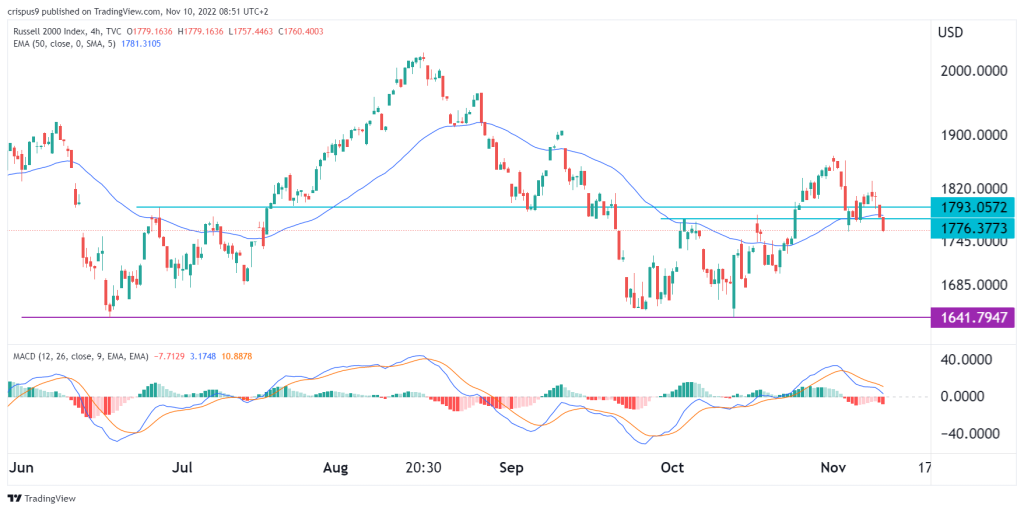
The four-hour chart shows that the Russell 2000 index formed a double-bottom pattern at about $1,641. In price action analysis, this pattern is usually a bullish sign. It has now dropped and moved below the double bottom’s neckline at $1,776.
The index has moved slightly below the 50-day moving average while the MACD is moving below the neutral line. It also dropped below the important support at $1,793, which was the highest point on June 28.
Therefore, the index will likely continue falling as sellers target the next key support at $1,700. A move above the resistance at $1,793 will invalidate the bearish view.