- The Rivian stock price prediction indicates that there is a high potential for additional losses on the stock.
The latest vehicle sales figures of Rivian Automotive Inc have done little to improve Rivian stock price predictions to the upside, as the stock is trading lower by 5.26% in Wednesday’s trading session. This decline puts Rivian on the path to a fourth successive day of losses.
On Tuesday, the company announced that it produced 2,553 vehicles in the first quarter of 2022, matching its expectations. The company said it had delivered 1,227 vehicles of the built number and said it was on course to make good on its annual production guidance of 25,000 cars.
However, the market does not seem to have been enamoured by the numbers. In response to Rivian’s forward guidance provided in March, Wedbush Securities said it did not feel that the significant cancellation of reservations from customers would dent the company’s growth projections. Wedbush had cut its price targets for Rivian by more than half. The cancellations came after Rivian Automotive raised its vehicle prices by 20%. Angered customers cancelled their vehicle orders, prompting a reversal of the price increase 48 hours later.
Rivian’s 25,000 annual production figure is below the market’s expectations of 40,000. Wedbush Securities feels the company has several internal issues of logistics and execution of its processes, which informs the decision to cut the Rivian stock price prediction from $130 to $60. Sadly, the company’s stock has dipped even further since Wedbush’s price downgrade. Can the bulls arrest the slide at the next support mark?
Rivian Stock Price Prediction
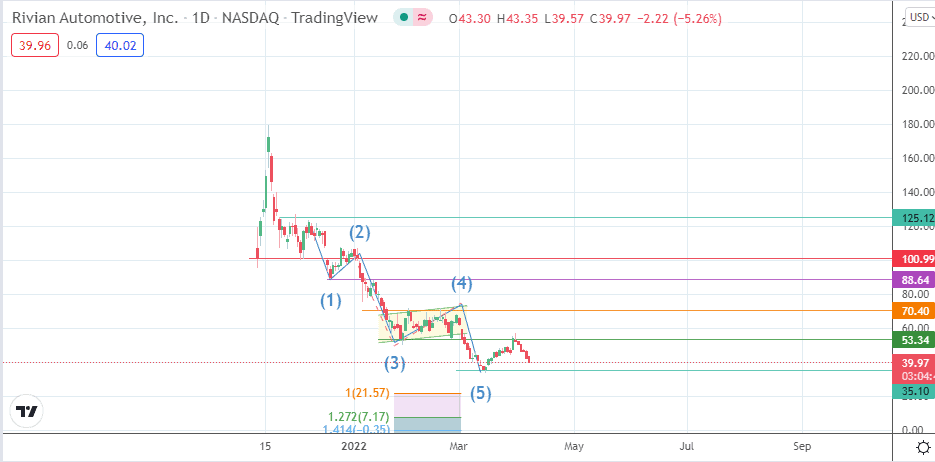
The rejection of the bullish price action at the 53.34 resistance set off the decline, which mimics the “b” wave of the Elliot corrective wave sequence. This follows the completion of the 1-2-3-4-5 impulse wave sequence that took Rivian from the 125.12 resistance to the 35.10 support level. If the 35.10 support (14 March low) gives way, additional support may come in at the 21.57 price mark (100% Fibonacci extension) or the 7.17 price level (127.2% Fibonacci extension from the bearish flag’s price swing). The last two legs of the impulse wave sequence were the bearish flag consolidation and measured move following the flag’s breakdown.
On the other hand, a bounce on the 35.10 support allows the stock to push for a leg higher to complete the corrective wave pattern at 70.40 (17 February high). 53.34 (28 March high) is a potential obstacle to completing this move. If this price mark is breached to the upside, 88.64 enters the mix as the next upside barrier. 100.99 and 125.12 complete additional targets to the north.
Rivian: Daily Chart