
- The breakdown of the symmetrical triangle on the XRP/USD chart has set off bearish Ripple price predictions.
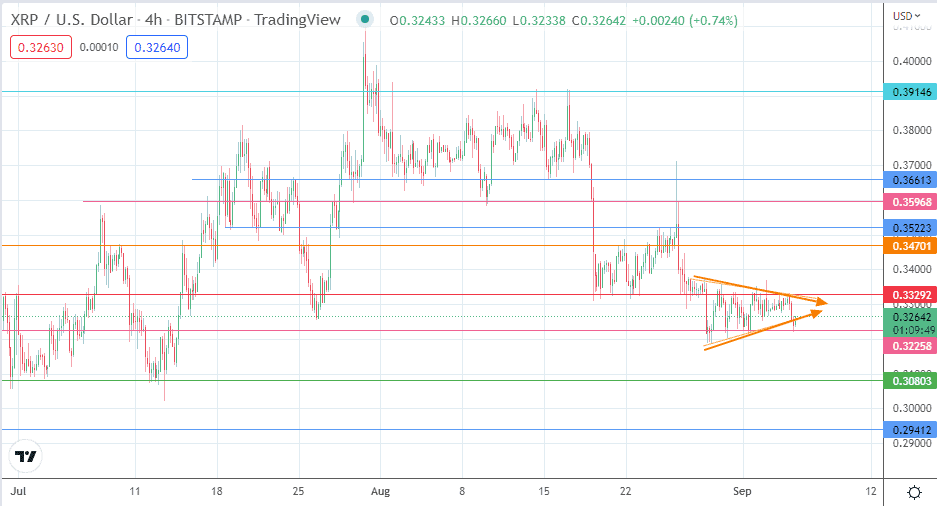
A failed break of the 0.33292 resistance has precipitated a 1.80% selloff on the XRP/USD pair, setting off new bearish Ripple price predictions. Ripple price action is correlated with that of Bitcoin, and today’s slide follows that of Bitcoin, which fell 1.15% in the day’s trading.
The decline in Ripple price and accompanying bearish Ripple price predictions do not seem to slow down interest in the asset, as discerning investors appear to be applying DCA principles to snap up the token at lower prices. CoinShares, a site that measures crypto fund flows, reported in its latest publication that Ripple attracted positive fund flows for the third week. Ripple is said to have brought in a positive flow of $200,000.
Regarding Ripple’s case with the SEC, not much has happened in the last few days to impact the price significantly. This leaves the XRP/USD pair’s price action subject to the technical pattern seen on the chart. The Ripple price prediction based on the current chart pattern is presented below.
Ripple Price Prediction
The XRP/USD daily chart features a rising wedge, which has produced a downside move that forms the base of the symmetrical triangle. The lower border of this triangle has been breached, with the active 4-hour candle now making a return move that is testing the broken lower border.
A rejection of the return move has to contend with the intraday support at 0.32258 (1 September low). A breakdown of this support allows the downside measured move to play out, targeting the 3 July and 12 July low at 0.30803. A breakdown of this price mark makes the 0.29412 support (14 June low) an additional harvest point for the bears.

On the flip side, a bounce on the 0.32258 support needs to overcome the immediate resistance posed by the triangle’s borders and the 0.33292 resistance level (22 August/28 August lows and 4 September 2022 high) to invalidate the bearish expectation.
This move also allows the 0.34701 to come into the picture as a potential upside target (21 August high). The 0.34000 psychological price level forms a pitstop along the way. If the advance move continues, the 0.35223 and 0.35968 resistance barriers form additional harvest points for the bulls.