- The Render token price prediction sees the RNDR/USDT pair needing to stay above the 1.0881 resistance to avoid a steep drop.
The RNDR/USDT pair is up 10.51% today as it continues a slow recovery process from the steep downfall it recently suffered. This scenario puts the token in good stead to make it the fifth day of gains, but these have not translated into bullish Render token price predictions.
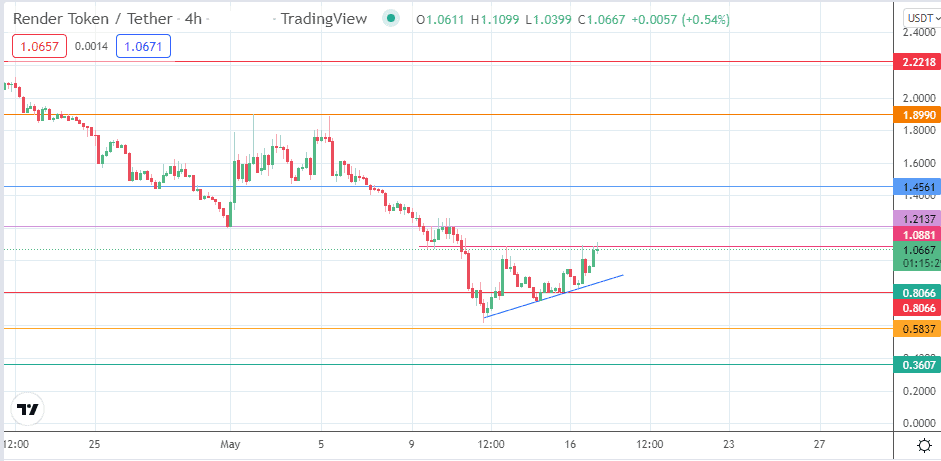
The recent decline came off a double top on the 1.8990 resistance. This pattern was completed when the pair broke below the 1.4561 support, with the measured move extending below the completion point at 1.2137. The recent recovery was fuelled by the 13 May pinbar candle that closed above the 0.8066. Subsequent candles have stayed above this support, with the ascending trendline providing the pivot for higher lows seen in the price action.
Technically speaking, the token is finding it difficult to breach the 1.0881 resistance line, which has capped the recovery attempts for several days. However, if any bullish Render token price predictions are to hit the market, this is the price to beat for the bulls in the short term.
Due to the lack of any fundamental triggers, price action on the RNDR/USDT pair and any Render token price predictions will be based on market participants’ response to the prevailing market sentiment. In addition, the pair remains in a downtrend, so any rallies presently make it easier for short-sellers to seek rally-selling opportunities.

Render Token Price Prediction
The ascending trendline on the 4-hour chart provides immediate support for the RNDR/USDT pair. The pair is now challenging the resistance at the 1.0881 price mark (13 May high). A break of this barrier creates access to the 1.2137 barrier (17 October 2021 high and 30 April 2022 low). There is an additional northbound target at 1.4561, after which the bulls will have clear skies to aim for the 1.8990 price barrier (2 May and 5 May highs).
Conversely, rejection of the advance at 1.0881 could lead to a pullback that tests the ascending trendline. This trendline and the support at 0.8066 (1 October 2021 low) must give way for the 0.5837 support (12 July 2021 low) to become visible. Further price deterioration allows the bears to make a move on 0.3607 (22 June 2021 low). Below this level, the pair makes new record lows.
RNDR/USDT: 4-hour Chart