


- Bearish QNT price predictions are looking to continue following the breakdown of the symmetrical triangle on the daily chart.
Bearish QNT price predictions may continue to saturate the market as far as Quant tokens are concerned. This is because of the breakdown of the symmetrical triangle on the daily chart.
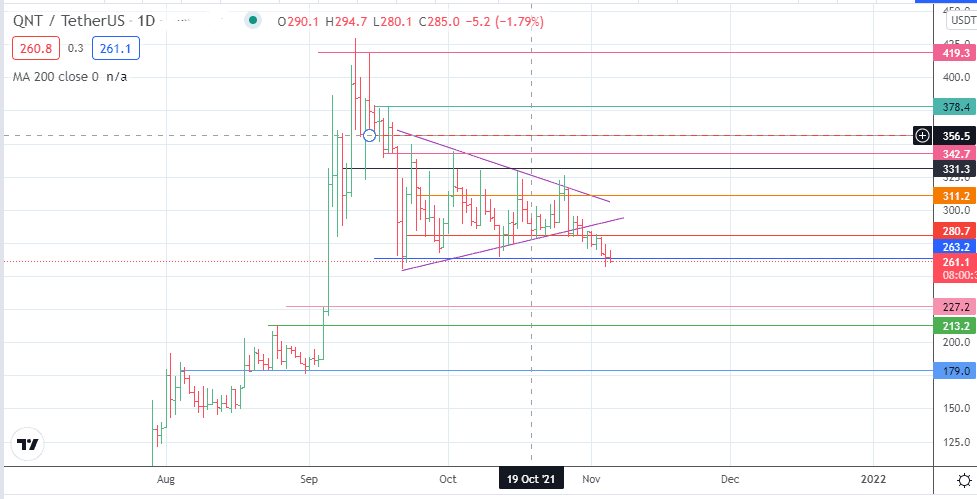
The QNT price has continued to fall since hitting its peak of 430.0 on 11 September. The initial decline was followed by consolidation, with lower highs and higher lows defining the symmetrical triangle. This pattern in most cases continues the prior trend, which in this çase was downwards as price corrected from the 11 September high. With the breakdown of the triangle and subsequent support at 280.7, the stage appears set to continue the corrective decline.
Here is the QNT price prediction based on the picture on the daily chart.
QNT Price Prediction
The decline below the symmetrical triangle continues the corrective decline and now targets the 263.2 support level. This support level needs to give way for the bears to push towards the 227.2 support level. 213.2 and 179.0 are additional downside targets that will appear once the bears take out the 227.2 support mark.

This outlook will change if the bulls can defend the 263.2 support level. This scenario could lead to a bounce that targets 280.7, with 311.2 and 331.3 serving as additional upside targets. Attainment of the latter two targets requires significant bullish momentum on the part of the bulls.
QNT Daily Chart
Follow Eno on Twitter.