

- Polygon price has been trading within a rather tight range for a week now. However, it will likely remain above $1.4000 in the short term.
Polygon price has been trading within a horizontal channel for a week now. According to CoinMarketCap, the altcoin’s market cap has dropped by 2.25% while its trading volume is down by 3.91% from the past session.
In comparison, the global crypto market cap has declined by 3.28% even as it remains above the crucial 2.5 trillion mark. The total crypto trading volume has also fallen by 3.27% over the past 24 hours.
Polygon price prediction
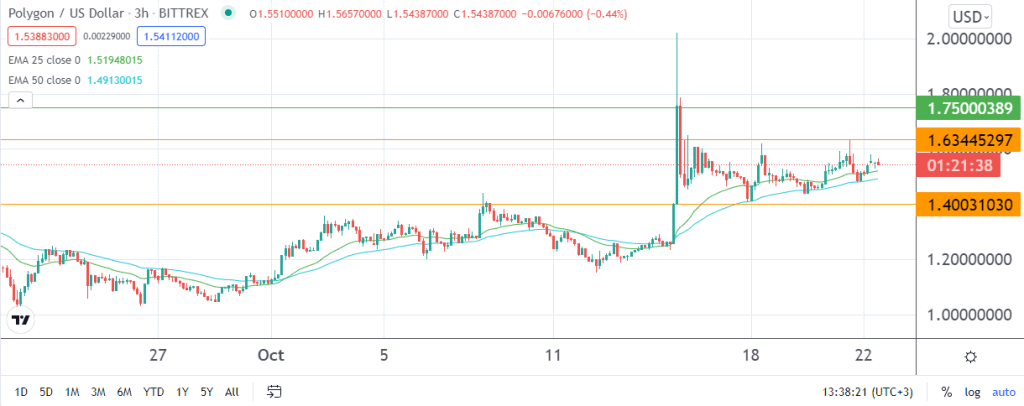
MATIC is still finding resistance at 1.6000 while holding steady above 1.4000. Since early-September, 1.4000 was a major resistance zone for the altcoin. After pulling back from a 5-month high of 2.0236 a week ago, it has turned into a steady support level.

Polygon price has been trading within a horizontal channel of between 1.4003 and 1.6344 for a week now. At the time of writing, it was up by 2.14% at 1.5438. On a three-hour chart, it is trading slightly above the 25 and 50-day exponential moving averages.
While I hold a bullish bias, the outlook is rather neutral. In the short term, I expect the crypto to remain above the crucial level of 1.4000. As such, it will likely continue trading within the aforementioned channel. If the bulls gather enough momentum to break the resistance along the channel’s upper border, the next target will probably be at 1.7500.