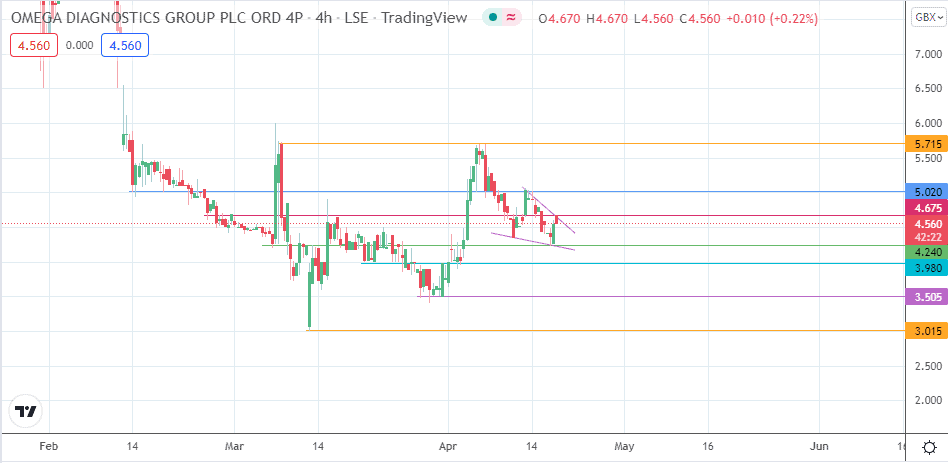
- The falling wedge on the 4-hour chart could point towards a 5.36p target for the Omega Diagnostics share price.
The Omega Diagnostics share price is trading higher on the day and looks set to snap a 2-day losing streak. The company hopes to build on its performance in early April as it seeks to move past its COVID-19 diagnostics misadventure.
In early April, the Omega Diagnostics share price gained 20.73% after the company said it expected a 41% increase in annual revenues for the year ended 31 March 2022. Some of this growth came from the health and nutrition division, which contributed 1.8m pounds more than in the previous year.
However, the company’s ongoing contract dispute with the UK government was enough to put off investors, which sent the stock downwards for the rest of the month, erasing its early April gains.
The Omega Diagnostics share price has undergone a monumental collapse in the last four months, triggered by boardroom events and the refusal of the UK regulator to grant the company approval for its COVID-19 antigen test. Former CEO Colin King resigned unexpectedly earlier in the year.
The company also had to offload its loss-making diagnostic testing kit manufacturing business in Scotland to China-based Zhejiang Orient Gene Biotech for 1 million pounds. Since then, the stock has been trading in a very tight range at the lower end of the single-digit price mark. The stock is 3.33% higher on the day, recovering from earlier session lows.
Omega Diagnostics Share Price Outlook
The outlook for the Omega Diagnostics share price is pulled off the 4-hour chart, where we see recent price action trading between the 3.015 price floor and 5.715 price ceiling. The price action is forming a falling wedge pattern, with the intraday high testing the resistance at the 4.675 price mark (23 February and 8 April highs).
A break above 4.675 resistance also completes the falling wedge pattern, opening the door towards the 5.020 resistance barrier (23 February and 13 April highs). The 5.715 price ceiling of the short term range on the higher timeframe charts forms the additional target to the north. There is a potential for a pitstop to form at the 5.365 price mark (21 February and 7 April highs).
On the flip side, rejection at the 4.675 resistance sends the price activity towards the opposing wedge border, which sits on the 4.240 support line. A breakdown of this support invalidates the pattern and opens the door for a run towards the 3.980 pivot (7/23 March lows). 3.505 (22 March and 4 April lows) and 3.015 are the other potential harvest points for the bears if the stock continues on the path of its monumental collapse.
ODX: 4-hour Chart


