

- The completion of the descending triangle on the daily chart could trigger new Shiba Inu coin price predictions this week.
As predicted in the last piece I wrote about Shiba Inu, there has been a downward continuation of the trend after the descending triangle resolved and triggered new bearish Shiba Inu coin price predictions in the market. The situation became clearer this weekend after Bitcoin prices teetered towards the 25k mark, dragging the entire market with it.
The SHIB/USDT pair is down 3.37% this Monday, following steep declines over the weekend that saw the pair losing more than 20% of its value. Nevertheless, the pair looks good to close out the session lower, which will mark a 7th straight day of losses.
The latest selloff sends the pair towards its October 2021 lows, coincidentally marking the point at which it rallied heavily. However, technically speaking, the pair still has room for additional downside, as the measured move from the collapse of the descending triangle has still not been completed.
On the fundamental side of things, Shiba Inu continues to witness an increase in the number of whale purchases. Whale addresses have jumped 44%. Data from WhaleStats indicate that the utility of Shiba Inu has made it one of the most actively used smart contracts among the top 2000 ETH whales over the weekend.
However, the market sentiment around Shiba Inu remains dominated by the price activity on Bitcoin and not by inherent fundamental triggers. This may allow for further bearish Shiba Inu coin price predictions this week.
Shiba Inu Price Prediction
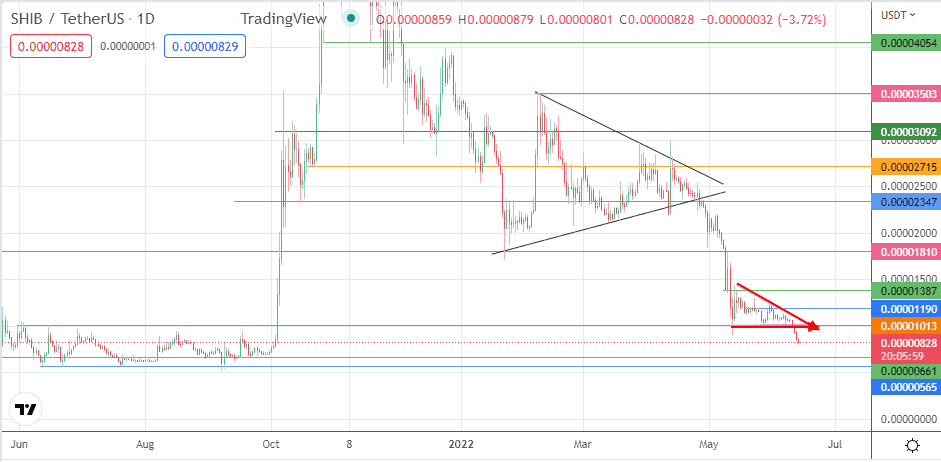
Following the completion of the descending triangle, the 21 May 2021/30 August 2021 lows at 0.00000661 appears to be the next target in line for the bulls. This support level marks the completion of the triangle’s measured move. A further decline towards 0.00000565 (12 June 2021/22 June 2021 double bottom) follows if there is additional price deterioration.
Conversely, any potential recovery rally from the present levels will first test the 0.00001013 resistance (31 May 2021 high/27 May 2022 low). This barrier must be uncapped before the 0.00001190 price mark comes into the picture. Additional resistance barriers are seen at 0.00001387 (13 May 2022 high) and at 0.00001810.
SHIB/USDT: Daily Chart