

- The Loopring price prediction highlights the presence of two shooting star candles, which signal an imminent correction.
The Loopring price prediction relies on the picture on the daily chart, which shows two shooting star candles that appear to point towards a near-term correction. Loopring shot to new highs in Thursday’s trading session, but the price has since pulled back from those highs and now trades 8.97% lower on Friday.
The recent LRC/USDT price action surge follows the potential deal between the Loppring project and GameStop. The game retailer intends to integrate Loopring into its proposed non-fungible token (NFT) marketplace, and GameStop made this known in a recent publication.
Loopring Price Prediction
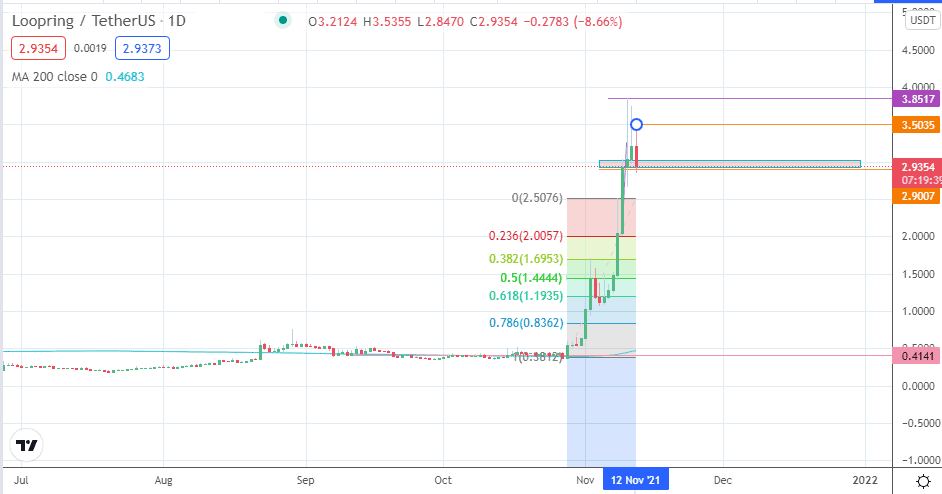
The daily chart on the LRC/USDT chart shows two prominent shooting star candles. However, the lows of these candles are still contained within the support zone found between 2.9141 and 3.0213. The low of the active candle has to achieve a closing penetration below this support zone by at least 3% before the breakdown is confirmed. This move would open the door for a decline that targets 2.5076 initially, followed by 2.0058 and 1.6953 if the deterioration is more extensive.

On the flip side, a bounce on the support zone allows the price action to initially aim for the 3.5035 mark. If the bulls uncap this level, the all-time high at 3.85 comes back into focus. Clearance of this level takes the pair to new highs, with 4.500 definitely in the running as a new upside target.
LRC/USDT: Daily Chart
Follow Eno on Twitter.