


- The Litecoin price prediction is for the price activity to continue to trade in a range in the absence of major price triggers.
The Litecoin price prediction has not changed much from the last update. The price activity remains range-bound, primarily due to the same situation playing out on Bitcoin and in several other BTC-correlated assets. The initial bearish reaction to the Russian invasion of Ukraine has died out, and the markets continue to wait for the next big news that could propel some recovery on the LTC/USDT pair. Litecoin is coming off the MWEB upgrade, said to be the largest it has ever undertaken. This upgrade promises fungibility and is also expected to improve the token’s scalability.
The Litecoin team appears to be trying to make a case for adoption, citing it as the most popular crypto payment choice after Bitcoin. Transactions on the Litecoin network appear to be picking up. In a data survey published on its Twitter page, the Litecoin team indicated that the crypto was responsible for 15.21% of all transactions on the BitPay network, second to Bitcoin, which remained far ahead at 58.18%. The data set did not include other networks such as Solana and Tron.
Litecoin Price Prediction Outlook
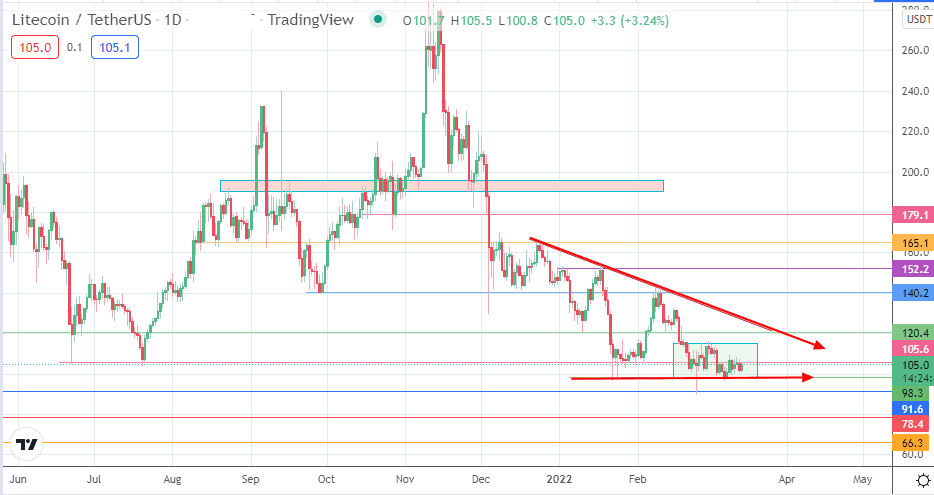
The daily chart reveals that the price picture has not changed much from the last Litecoin price prediction made here. The most recent price activity trades in a range, forming a rectangle pattern. Upside movement within the rectangle is capped by the 105.6 resistance mark, while the 98.3 support forms the floor.
The bigger picture shows the evolving descending triangle pattern, whose completion could have bearish implications for the LTC/USDT pair. A breakdown of the 98.3 support completes the triangle and opens the door to a measured move that will have contention at 91.6 (24 February 2022 low), 78.4 (16 December 2020 low), and 66.3 (26 November 2020 low).

On the other hand, a break above the rectangle will immediately challenge 120.4. If this resistance gives way to bullish pressure, 140.2 could be the nearest resistance. Attainment of this level (27 September 2021 low and 10 February 2022 high) invalidates the triangle. Additional targets to the north include 152.2 and 165.1, but in reality, these are out of reach at the moment and will require a change in the current market sentiment to attain.
LTC/USDT: Daily Chart
Follow Eno on Twitter.