

Order flow trading is an analysis technique used to analyze real-time market sentiment from executed orders, bid and offer activity, volume delta, liquidity, and order book behavior.
In contrast to the usual question of where the price has gone, order flow trading seeks to know why prices went there and who made them go.
What Is Order Flow Trading?
Order flow trading is an analysis of the way that market orders come into the market, interact with the market liquidity, and affect the price action. In simple terms, it analyzes the connection between aggressive participants who initiate market orders and passives who offer their liquidity using limit orders.
Traditionally, technical charting analysis shows us the results of market action through:
- Candles
- Trendlines
- Support and resistance
- Indicators
Order flow analysis digs one step deeper by analyzing the trades behind the price action. Market microstructure research has been studying the impact of trades, liquidity, and order flow on price formation for years (Source: Hasbrouck, Journal of Finance; Kyle, Econometrica).
In order flow trading, you analyze several key factors:
- Whether buyers have absorbed the offers
- Whether sellers are hitting bids
- If the volumes confirm your idea
- If some very large passive trades are absorbing the aggressiveness of buyers or sellers
That is why order flow analysis works best with futures trading, short-term stock index trading, scalping, and other intraday strategies.
Nevertheless, order flow trading does not represent a foolproof strategy and needs precise information and necessary tools. Professional market structure analysis also sees order flow as one of several elements involved in the process of price creation and not as a separate forecasting method. (Source: Hasbrouck, Journal of Finance.)
Order Flow vs Technical Analysis — Key Differences
Technical analysis examines the past behavior of prices. This includes the use of patterns like candles, moving averages, Fibonacci levels, levels of support, resistance, and patterns.
Order flow trading examines the actual buy and sell activities behind price behavior. Instead of focusing on just the direction of prices, this type of trading also examines the participants behind the moves and the liquidity support projection for the move.
For instance, a normal technical trader would observe gold breaking resistance to note a bullish breakout in the metal. However, an order flow trader would try to analyze whether there was heavy lifting of asks from the sellers and positive delta volume supporting the breakout move. Also, he would note whether there were any sellers accepting the offers at a higher price.
The importance of the distinction lies in understanding that:
- Breakouts without strong order flow behind them tend to be vulnerable and can fail.
- Pullbacks with weak selling pressures imply that the sellers do not have control over prices anymore.
Market microstructure theory proves that market dynamics and trades influence price adjustment. (Sources: Kyle, Econometrica, Hasbrouck, Journal of Finance)
Why Professional Traders Use Order Flow
Order flow is used by professional traders because it offers insights into market participation, liquidity, and pressure at different price levels. Rather than basing their strategies on lagging indicators, order flow allows traders to observe current behavior.
In his studies on the informational content of stock trades, Hasbrouck proved that trades have an instrumental role in price discovery (Source: Hasbrouck, Journal of Finance). Similarly, the market microstructure model proposed by Kyle explains a gradual effect of informed trading on prices as a result of order flow and liquidity interaction (Source: Kyle, Econometrica).
Some of the queries answered using order flow by professional traders include:
- Is the trend caused by aggressive buy orders or low liquidity?
- Are institutional traders taking advantage of buying or selling pressure?
- Is volume confirming the breakout?
- Is price rejecting a high-volume zone?
- Are traders trapped after the failure of a breakout?
Such queries prove very helpful when dealing with highly liquid markets like:
- S&P 500 futures
- Gold futures
- Crude oil futures
- Currency futures related to major Forex pairings (such as EUR/USD)
Core Concepts in Order Flow Trading
Before using footprint charts, DOM, volume profile, or tape reading, traders must understand the basic mechanics of bid, ask, market orders, limit orders, delta and imbalance.
Bid and Ask — How the Order Book Works
The bid refers to the maximum price that buyers would pay for securities at any particular time. On the other hand, the ask (also referred to as the offer) refers to the minimum price at which sellers would sell the security. (Source: Investopedia)
For example, if EUR/USD is quoted at:
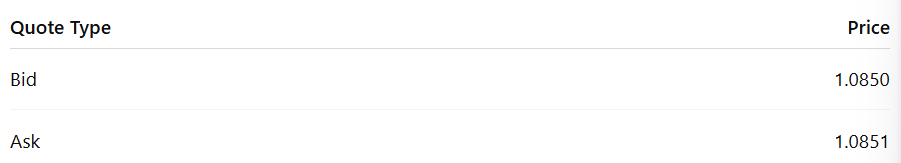
A trader who wishes to sell will always do so at the bid level. On the other hand, a trader wishing to buy will always do so at the ask level.
An order book represents the list of buy and sell limit orders at various prices. Buy limit orders will be placed below or at the existing market price, while sell limit orders will be placed above or at the existing market price.
Order books are easily visible in centralized markets like futures and equities markets. The situation differs slightly in spot Forex, since it is not a centralized trading system for foreign exchange trades on a global basis. (Sources: Bank for International Settlements, CME Group)
Market Orders vs Limit Orders
- Market Orders
A market order is a command to purchase or sell at the best price instantly. Speed comes first with market orders. (Source: SEC Investor.gov) - Limit Orders
A limit order is a command to buy or sell at a certain price or higher or lower. Price control takes precedence over speed. (Source: SEC Investor.gov)
This distinction is key to order flow trading:
- Market orders are deemed aggressive as they absorb liquidity.
- Limit orders are passive since they provide liquidity to the market.
Buyers using market orders pull the ask down, while sellers using market orders push the bid up. Order flow traders monitor such actions to determine who is more aggressive.
Volume Delta Explained
Delta Volume represents the disparity in the quantity of trading done on both sides. Delta Volume can be expressed mathematically as:
Delta Volume = Volume (Ask) – Volume (Bid)
Consider these scenarios:
- In the event that there are 1,000 contracts traded at the Ask level and only 600 contracts traded at the Bid level, the Delta Volume will be +400. This implies that buyers were aggressive at this moment.
- Alternatively, if there are 500 contracts traded at the Ask level while there are 1,200 contracts traded at the Bid level, the Delta Volume will be -700. This implies that sellers were aggressive.
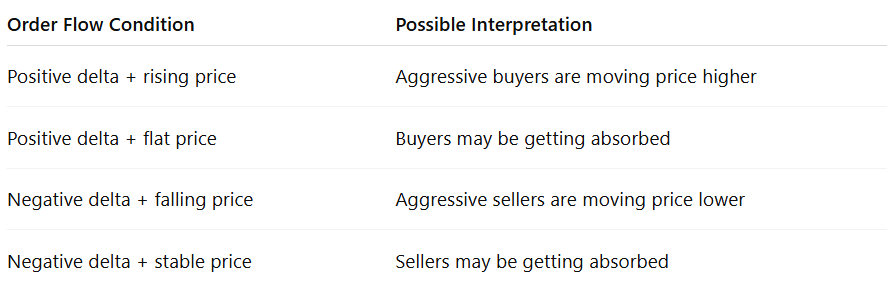
Notably, the importance of Delta Volume cannot be understated, though it is rarely used independently. Positive Delta Volume does not necessarily imply an increase in prices, while Negative Delta Volume does not necessarily imply lower prices. The essence lies in relating the value of Delta Volume against changes in price levels. (Source: Hashbrouck, Journal of Finance)
For example,
Cumulative Delta – How to Read It
Cumulative Delta is the accumulation of volume delta over time. Rather than focusing on one candle or short periods, it allows us to see whether buyers or sellers are being aggressive over a whole session.
There are two primary ways to interpret this movement:
- When we see Cumulative Delta move upwards during the trading session as price increases, it indicates that buyers are being aggressive.
- When Cumulative Delta falls along with falling price, sellers are dominating the market.
But what makes it more fascinating is when price and Cumulative Delta move against each other. For instance, gold rallies up to the previously tested resistance area even as Cumulative Delta keeps moving upwards. This initially gives a bullish indication.
However, if price fails to rally further despite the high Cumulative Delta, then there could be some absorption going on. While buyers are showing signs of aggressiveness, the sellers are strong enough to absorb their efforts. This is called the effort versus results issue.
Imbalance and Absorption
Bid-ask imbalance refers to the situation where one side of the trade conducts significantly higher volumes compared to the opposite side at a certain price level.
For instance, if the footprint chart indicates that there were 2,000 contracts at the ask level while only 300 contracts at the bid level, the buyers are extremely active at that price level. Imbalance may suggest that the buying-selling interest is quite strong. However, investors need to take precautions because a substantial imbalance close to the breakout point may confirm continuation, while the same scenario at the top of an extended run may imply exhaustion.
Absorption happens when aggressive orders encounter massive passive liquidity. This means that the buyer repeatedly lifts the ask, yet no increase in price takes place due to passive sellers continuously replacing their sell limit orders.
In practice:
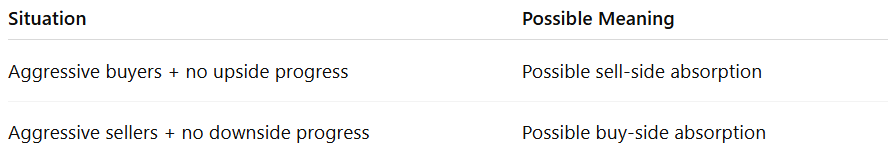
Absorption is one of the most important concepts in order flow trading, because it helps traders identify areas where visible pressure is not producing the expected price movement.
Order Flow Trading Tools and Charts
There are various trading tools used by order flow traders for studying market behavior:
- Footprint charts
- Depth of market
- Volume profile
- Time and sales
Footprint Charts Explained
The footprint pattern displays the volume that is traded in each candle for each price level. While the candle pattern displays open, high, low, and closing prices, the footprint pattern displays the volume that was traded at the buy or sell price. (Source: Investopedia.)
Annotated Footprint Chart Example — Gold Futures
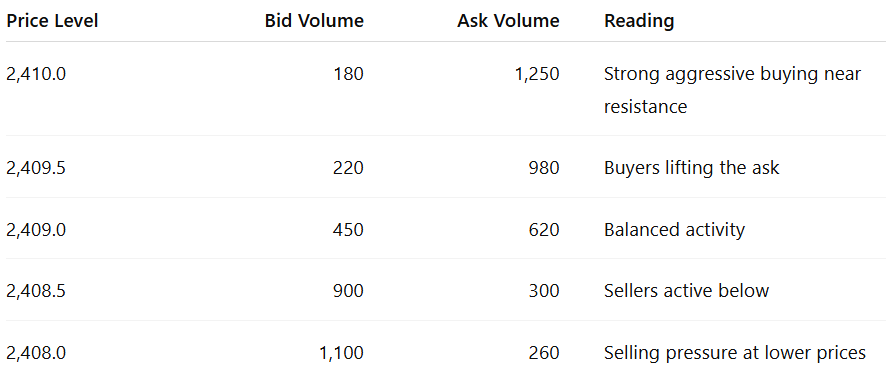
Here, in this instance, we see heavy buying action at the top of the candle. The buyers have been very active around the area of 2410. However, if the price did not manage to rise beyond 2410 and reversed sharply lower, then this footprint could indicate a case of absorption rather than continuation. The important takeaway here is that high buy volume doesn’t always mean that the price will go up.
Depth of Market
Market Depth (DOM) provides insight into bid and offer limit orders at various prices. DOM trading is typically practiced by futures scalpers and day traders since it presents liquidity around the current market level (Source: Investopedia, CME Group).
Market Depth typically includes:
- Bid size below the market level
- Ask size above the market level
- Last transaction price
- Liquidity in the order book
- Changes in resting orders
Annotated DOM Example — S&P 500 Futures
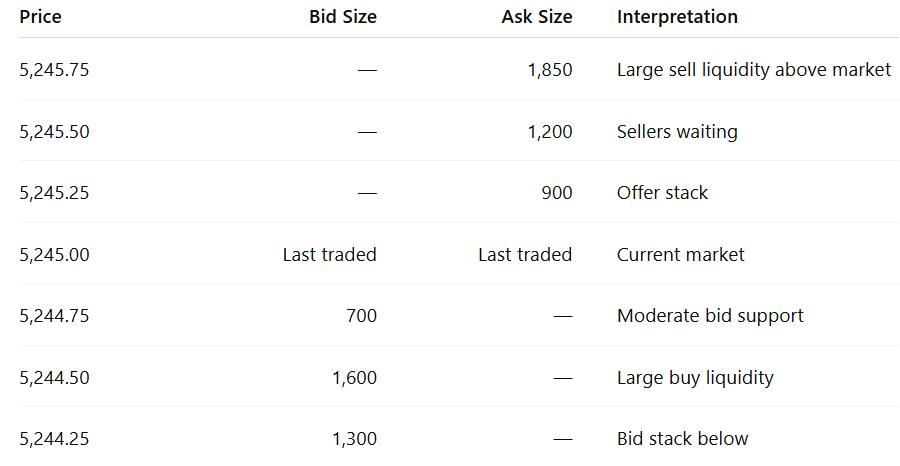
The repeated raising of the bid above 5245.50 without being able to penetrate through the huge sell liquidity might mean short-term absorption.
DOM is prone to misinterpretation: the resting orders can easily be cancelled, rerouted, or revised, so the trader must not assume that all large orders will stay put. (Source: CME Group.)
Volume Profile
Volume Profile refers to the amount of volume that traded at certain price levels during a given period. Volume Profiles differ from Volume Bars since while Volume Bars depict volume based on time, Volume Profiles depict volume based on price levels (Source: CME Group).
The common terms used with regards to Volume Profiles include:
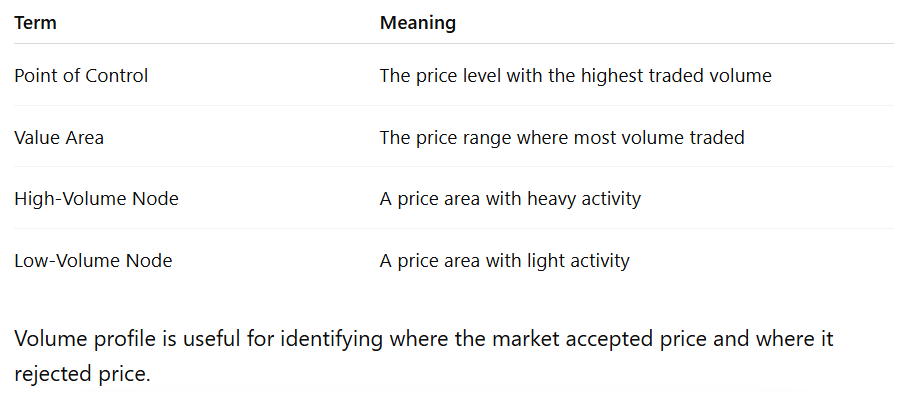
Annotated Volume Profile Example — Crude Oil
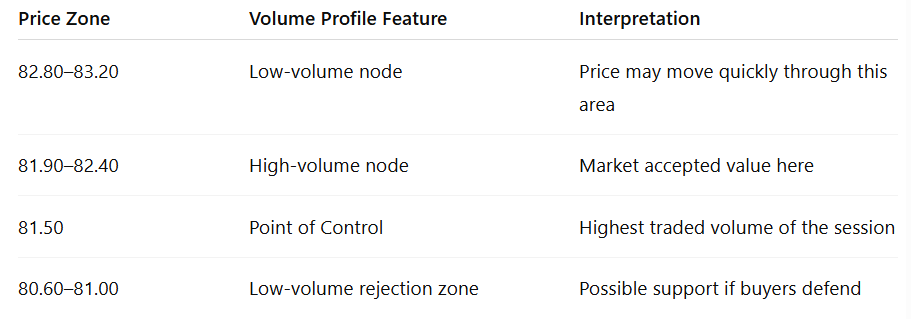
A possible failure for crude oil is breaking out above a low-volume node but dropping back into the value zone. If the price stays above the low-volume zone and volume increases, then it could be considered a value breakout.
Volume Profile provides additional information; however, it does not provide aggression levels in real-time on its own. For execution purposes, traders use it along with footprint or delta/tape reading.
Time and Sales
Time and sales is another name for the tape that reflects completed transactions. Tape reading concentrates on the volume, pace, price, and whether the transactions happen on the bid side or the ask side.
Tape readers can analyze:
- High volume hitting the bid
- High volume lifting the ask
- Accelerated pace of transactions
- Repetitive high volume at the same price
- Failure to continue after high volume
Annotated Tape Example — EUR/USD Futures Proxy
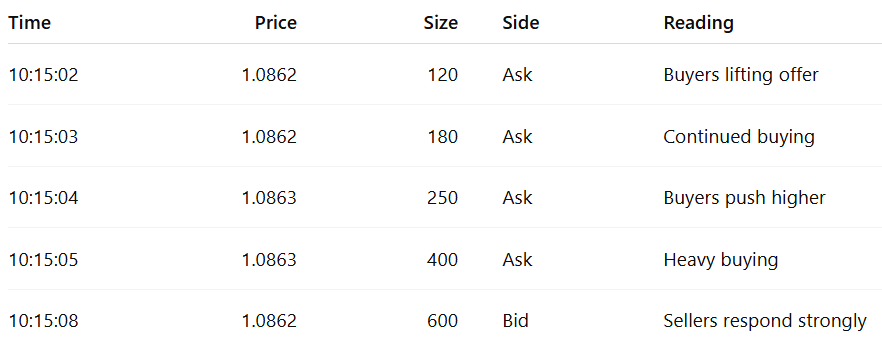
If there is an indication of heavy buying in the tape and price cannot go higher, it could mean exhaustion or absorption. If there is an indication of heavy buying and price immediately goes up to the next level, the move may be more forceful.
How to Read Order Flow in Live Markets
It makes sense for the trader to use order flow in context rather than trying to interpret single footprints, delta readings, or DOM levels.
Identifying Buying and Selling Pressure
Buyer-seller pressure is identified from order flow readings where the buyers or sellers continue to hit the bid-ask price with positive delta, leading to an increase or decrease in prices. Pressure needs to be determined in results.
For instance, if the S&P 500 was pushing against resistance but the buyers kept on lifting the ask price with a positive delta, then there is buyer pressure. Price will break above the resistance if the buyers are successful. On the other hand, if price breaks below the resistance after a failed attempt above it, the buyer pressure shows that they were trapped.
The trader might want to ask himself this question: Was the market rewarding the aggressive side?

- If the buyers had been the aggressive side, the market price should rise.
- The sellers would have caused price movement downwards.
Where this doesn’t happen, there might be absorption or exhaustion.
Spotting Institutional Activity
The term institutional order flow is defined as trading that may occur due to large funds, banks, hedgers, asset managers, or high-frequency participants. While retail traders might not detect the presence of institutions, they can look for evidence that may indicate the participation of larger players.
Indicators might be:
- Big volume at key levels
- Multiple buys at the same price
- High volume without immediate follow-through
- Liquidity changes in the DOM
- Large volumes showing up on the tape
- Breakouts with wide volume confirmation
For instance, if gold moves down to an important support area and there are aggressive selling pressures pushing prices against the bids, yet prices fail to move lower, there might be passive buyers buying supply. Although this does not mean that institutions are buying, it shows that there could be larger liquidity around that level.
Studies on market microstructure show how order flow trading and liquidity can affect price movement, especially when aggressive traders confront limited liquidity. (Source: Kyle, Econometrica, Hasbrook, Journal of Finance)
Reading Exhaustion and Reversal Signals
Exhaustion happens where aggressive traders keep pressing forward, yet the markets refuse to move further.
- Bullish Exhaustion Scenario
(a) The price moves up against resistance.
(b) Delta becomes positive.
(c) The footprint displays strong volume on the asking side.
(d) The price is unable to create a new higher top.
(e) The next bar closes below.
This could indicate that buyers have made a lot of efforts without gaining much ground.
- Bearish Exhaustion Scenario
(a) The price declines towards support.
(b) Delta becomes negative.
(c) Sellers aggressively hit bids.
(d) The price fails to create a new lower bottom.
(e) Buyers manage to drive prices back above support.
This could indicate that sellers are caught. Exhaustion signals work better where there is some technical significance, like previous support or resistance, value area high or low, or key session levels.
Order Flow Trading Strategies
Order flow strategies should not be used mechanically. They work best when combined with market context, risk management and a clear invalidation level.
Absorption Strategy
This strategy identifies a scenario where aggressive participants cannot drive the price through an important level. For example, the price of gold moves into a resistance area around its recent high. The footprint analysis shows a significant positive delta value, indicating that buyers are actively bidding on the offer side, but the price does not break out above the resistance level despite these attempts.
A trader applying this strategy will wait for signs such as:
- Resistance breakout failure
- Negative delta reversal
- Strong rejection bar
- Price reversal below the breakout point
It does not mean that because the volume of buyers is increasing, you should buy. It means the other way around: volume of buyers is increasing but the price is not moving, hence buyers must be trapped.
Imbalance Breakout Strategy
The imbalance breakout strategy involves finding an aggressive accumulation or distribution of orders that drives prices to break through an important level with confirmation.
Example: The S&P 500 consolidates under resistance. Footprint charts reveal strong imbalance activity on the offer side around the upper end of the trading range. Cumulative delta increases, volume swells, and prices break out through the resistance level. If prices stay above the breakout area, then the imbalance could contribute to continuation.
Confirming elements include:
- Significant bid-ask imbalance in the direction of the breakout
- Increasing volume
- Price acceptance above or below the breakout level
- No reversal immediately after the breakout
- A pullback that stays above the old resistance or below the old support level
False breakout poses a risk. For this reason, order flow trading generally seeks price acceptance following a breakout rather than a single aggressive candle.
Volume Profile Support and Resistance Strategy
The strategy utilizes volume profile in determining points of acceptance and rejection by the market. For instance, crude oil trades in an area where there is a high volume of nodes at 81.50, representing a fair value area. The price then moves above a low volume node at 82.80. With the buyers protecting the low volume area, the market could keep on moving up. If the price moves above a low volume node but reverts below, the breakout will probably not be accepted.
The following components are mostly used in this strategy:
- Point of Control as a magnet
- Value area high as resistance
- Value area low as support
- Low volume as fast move zone
- Order flow confirmation before entry
The trader gets the map from volume profile, while footprint, DOM, and Delta can determine acceptance or rejection.
Order Flow Trading Across Different Markets
Order flow behaves differently across markets because each market has its own structure, liquidity, and data limitations.
Order Flow in Forex
Order flow in Forex demands more care due to the decentralized nature of the spot Forex market, which does not have a central exchange displaying total global volume and order book information. (Source: Bank for International Settlements).
Consequently, spot Forex traders tend to base their analysis on:
- Broker level order book information
- ECN liquidity information
- Futures volumes
- Tick volume
- Any futures contract used as a proxy
If trading EUR/USD, one may use a Euro FX futures contract to analyze volume delta and footprints. Although the information obtained from this does not represent complete spot market data, it provides valuable insights in relation to aggression on major levels.
Forex order flow tends to be helpful when:
- Important macroeconomic announcements occur
- London and New York sessions happen
- Yesterday’s session highs/lows are approached
- Liquidity zones are present
- The decision period of central banks comes
The only problem is the lack of complete data, since traders are advised not to conclude that broker data represents total Forex.
Order Flow in Stock Indices
Index futures, like the S&P 500 futures, have been utilized in order flow trading due to their liquidity and centralized trading nature. Order flow trading can be observed using DOM footprint charts, volume delta, and the tape in an easier manner compared to spot forex.
The index order flow will prove helpful during:
- Cash market open in the U.S.
- Important economic releases
- Events of the Federal Reserve
- High and low of the previous session
- High and low of the Value Area
- Options-related levels
For instance, when the S&P 500 futures open higher than the value area of the previous session and the buyers react positively with delta, it is viewed as acceptance at value. Alternatively, when the price opens higher, but delta is lower and the sellers take charge, the rotation occurs back towards the previous value area.
Order Flow in Commodities: Gold and Oil
Gold and crude oil are common order flow trading vehicles since they are usually sensitive to macroeconomic events, geopolitical uncertainty, inflation expectations, and fluctuations in the USD.
Order flow in gold is usually observed during:
- U.S. inflation reports
- Fed speakers
- USD and Treasury yields
- Geopolitical events
- Prior highs and lows
Order flow in crude oil is usually observed during:
- Inventory reports
- OPEC news
- Oil supply risks from the Middle East
- Demand expectations
- Important futures expiries
For instance, crude oil might break out above its resistance level following positive inventory reports. In case the order flow shows aggressive selling on the bid side and prices remain above the breakout point, the breakout might be more credible. Otherwise, if there is heavy buying pressure but prices quickly revert back into their previous range, the breakout might fail.
Platforms and Software for Order Flow Trading
Trading of the flow demands higher-order computer software compared to that which would be used in traditional chart analysis. Simple candlestick charts do not suffice where one needs to analyze footprint, volume delta, and DOM or tape activities.
What to Look in an Order Flow Platform
Your message and order flow system needs to offer easy access to dependable market data and powerful charting capabilities. The trader should pay less attention to marketing the product and more attention to the functionality offered.
Key components are as follows:
- Live market data
- Footprint chart capability
- Bid-ask volume information
- Volume delta and cumulative delta
- Depth of market and liquidity ladder
- Time and sales
- Volume profile
- Session templates
- Playback ability for practice
- Risk control options
The quality of the data matters. Delayed or incomplete data can reduce the value of order flow analysis, especially for short-term trading.
Key Features: Footprint, DOM, Delta
The three most crucial indicators for the majority of order flow traders are footprint charts, DOM, and Delta:
- Footprint charts enable traders to identify the area within the candle where the buying or selling took place.
- DOM enables traders to analyze liquidity and changes to the order book in the short term.
- Delta enables traders to assess aggressive buying and selling over time.
Together, these indicators assist in determining the following:
Does price action occur due to aggressive traders taking control of price movement based on liquidity?
Order Flow Trading vs Price Action — When to Use Each
Order flow trading and price action trading are not at odds with each other; they are best used in tandem.
Price action provides the framework. It tells you what the trend is, where support and resistance levels are, what consolidation areas and breakout levels are like, and where invalidation levels exist.
For instance:
- While price action shows EUR/USD testing support, order flow tells you how aggressive the sellers are about hitting the bid or absorbing the selling pressure.
- While price action shows gold breaking above resistance, order flow tells you if there are any strong buying pressures lifting the ask.
Here is an example workflow:
- Use price action to spot your key levels.
- Use volume profile to gauge value and acceptance.
- Use footprint or delta to read aggression.
- Use DOM or tape to refine your short-term execution.
- Know your risks before you trade.
However, order flow trading should not be used to negate the importance of market structure; otherwise, it may turn into just noise without any context.
Common Mistakes in Order Flow Trading
Here are the five common mistakes:
- Assuming order flow is a surefire way to trade
(a) A positive delta doesn’t necessarily mean buy, nor does negative mean sell.
(b) The markets have a tendency to catch aggressive traders out, particularly around key levels. - Failure to consider the context
(a) A bullish imbalance occurring within a volatile trading range might be meaningless.
(b) However, an imbalance occurring within a breakout level could be of great significance. - Relying too much on order book information
(a) Liquidity tends to evaporate fast once tested by the price action.
(b) Attention should instead be paid to price action rather than the location of liquidity. - Using order flow without adequate experience
(a) Cumulative delta, footprint charts, and tape analysis require time to learn.
(b) Beginners tend to overreact due to having too much information. - Applying futures-style order flow analysis to Forex without knowledge of underlying data problems
(a) Since Forex is decentralized, one needs to know if they are dealing with broker flow, ECN data, or futures flow. - Ignoring risk management.
(a) no matter how good your order flow system is, it can still go wrong. Every trader needs to understand what invalidation is and how to control his positions.
Frequently Asked Questions
Order flow trading may be more appropriate for intermediate to advanced traders. While beginners can learn the basic principles, live order flow can be extremely dynamic and complicated. Before using tools such as footprints, DOM trading, or cumulative delta, traders must master key skills, including understanding support and resistance, market structure, risk management.
It is possible to trade order flow in Forex, albeit with certain constraints. The spot Forex market is highly decentralized, meaning that traders do not have access to a single order book. Several forex traders utilize various proxies for liquidity, including broker data, ECNs, tick volume, currency futures as proxies. (Sources: Bank for International Settlements; CME Group.)
While Volume Profile is concerned with volume traded at each price level, Order Flow refers to the manner of executing trades in real-time. Volume Profile identifies the value area, high volume nodes, low volume nodes, and point of control. On the other hand, Order Flow involves bid-ask activity, volume delta, cumulative delta, footprints, and tape reading.
Yes, most order flow traders will require the usage of some special software, such as candlestick charts that provide bid or ask volume, footprint charts, DOM, cumulative delta, and time and sales. Regular candlesticks are unable to provide all of this data in sufficient detail.
It is worth noting that order flow is most often used for intraday trading, and it is quite popular among scalpers and day traders. Nevertheless, order flow trading is applicable for higher timeframes together with the volume profile and levels.
