
- Mainland China economy has been sending signs of weakness, underlined by weakening consumer demand
- The 25,000 points mark is a psychological support and a drop below that level could trigger a deeper correction
- US Fed interest rate tone is also being watched and could extend current sideways action
The Hang Seng Index (HSI) performance this December has been interesting, to say the least. After a strong year with impressive gains not seen since 2017, the index has recently entered a period of sideways movement. Currently, the index is hovering around 25,476 points, up slightly by 0.03%. Traders are now questioning whether the recent slowdown in the China trade is just a temporary pause or the beginning of a more significant downturn.
Why the Hang Seng Index is Sending Mixed Signals
According to the South China Morning Post, tech giants are facing pressure due to concerns about an AI bubble. This has dragged down the Hang Seng Tech Index. At the same time, there’s been bargain hunting, which has helped the index rebound. This is fueled by hopes for further fiscal support from Beijing.
The year’s gains have been supported by buying from mainland China and expectations of stimulus. Data from Trading Economics and The South China Morning Post shows China’s economy is a drag. Recent retail sales and credit data for November missed expectations, which proves mainland consumer demand is still weak.
Meanwhile, investors are being cautious as they await key economic data releases from the U.S. There’s concern about possible delays in interest rate cuts by the Federal Reserve and the broader implications of tariffs.
Is the 25,000 Psychological Support Under Threat?
The main question on everyone’s mind is whether the 25,000 points level will hold. This isn’t just an arbitrary number; it’s a level where buyers have historically stepped in, such as during the 2025 recovery. Reports from Morgan Stanley and OANDA suggest that as long as the index remains above this level, the medium-term positive outlook remains intact.
The index has recently dipped towards 25,200 but has managed to hold its ground, with recoveries driven by gains in various sectors and inflows from mainland China. If the index breaks decisively below 25,000, it could signal a more significant correction.

Overall, the Hang Seng reflects Hong Kong’s sensitivity to developments in mainland China and global risks. While short-term volatility is expected, the index’s position above key support levels suggests there’s still potential for gains if economic stimulus is delivered.
Hang Seng Index Forecast
The Hang Seng Index shows short-term uncertainty within a longer-term uptrend. The 14-day RSI is at 44, and rising. The pivot is at 25,200, and the upside will likely meet the first resistance at 25,616, at the 10-day SMA. Action above that level could result in further gains to test 25, 988, which corresponds to the 50-day SMA. On the downside, key support is at 25,000 (psychological), below which a deeper correction could follow, invalidating the upside narrative and potentially test the 200-day SMA at 24,650.
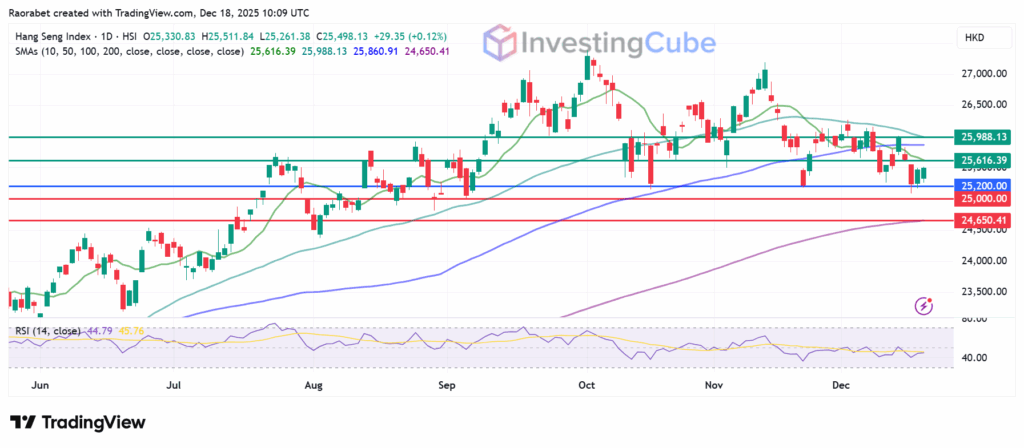
Hang Seng Index daily chart on December 18, 2025. Key support and resistance levels created on TradingView
Volatility stems from mixed China economic data, deflation worries, tech sector jitters, and caution ahead of U.S. indicators, despite stimulus hopes
While lower rates usually boost equities, the HSI is currently weighed down by weak Chinese economic data. Poor retail sales and a slump in the tech sector have offset the positive impact of cheaper borrowing costs
Based on the technical data, the 25,000 mark seems to be a key psychological support level. Even though the market is trending down, this level has held in the past. It’s worth noting that if it falls below that point, we might see a bigger drop.
