
- The Dow Jones Index is expected to grind out a bullish performance in 2026 if Fed easing expectations hold firm.
Dow Jones Index Live Chart
The Dow Jones Index is price-weighted, meaning that individual stocks that trade at high prices can heavily influence day-to-day moves, even in a stable market environment. We see this playing out in January 2026, when VISA and Salesforce suffered down moves that led to a heavy down day on 13 January 2026. The Dow closed 0.8% lower on the day.

Dow Jones Index Forecast 2026: Fundamental Drivers
The macro drivers for the Dow Jones Index are:
- Fed easing expectations
- Breadth of earnings
- AI Capex impact
- Policy risks and valuation
- Recession risk
1. Fed Easing
The expectation for 2026 regarding US monetary policy is that the Federal Reserve will continue to cut rates. This is considered a dominant market catalyst for the Dow and has shaped bullish forecasts for the Dow Jones Index. Rate cuts reduced bond yields, making risky assets like stocks and stock indices more attractive. A combination of economic resilience and Fed easing sets the stage for robust corporate earnings, which could send the Dow to new highs.
2. Earnings
The heavy leaning of the Dow towards the financials, healthcare, industrials, and consumer franchise sectors means that the earnings picture from companies listed in these sectors has traditionally dictated the Dow’s performance. However, value sectors could benefit from a demand surge, which could prove supportive for the Dow.
3. AI Capex Impact
The AI market is no longer about chips and chipmakers. AI infrastructure is now the next growth area, making AI capital expenditure a key metric for determining companies’ earnings in the AI value chain. Business daily notes from the Investor have flagged surging demand for energy to power data centres and AI-enabled partnerships as behind Caterpillar’s strong showing.
4. Policy risk and valuation
The Dow index asset and other risk-associated assets will be subject to US government policy risk. US trade sanctions on countries like China, and various export prohibitions such as those on US-made microprocessors, continue to dominate policy risk headlines.
5. Recession risk
A Bloomberg report indicates that John Rogers of Ariel Investments has forecast a 15%-20% decline in the Dow from a reemergence of recessionary risks. This is just one of several analyst projections warning of a recession reasserting itself in 2026.
Dow Jones Index Forecast 2026
It is more customary for institutions to publish forecasts for the S&P 500 than for the Dow Jones Industrial Average. To translate these forecasts into the Dow, it is preferable to identify the various case scenarios for 2026.
Base case: The base case scenario sees the Dow Jones grinding higher on the backdrop of Fed easing without rotation, amid more robust earnings. For this to occur, the Dow has to be pushed by the financials, industrials, and healthcare stocks. Bias would remain positive but at the cost of higher volatility than in 2024-2025. The mid-band call is for a 52,000-55,000 price range by end-2026.
Bull case: Better-than-expected earnings and AI infrastructure expenditure spill over into companies listed in the financials, materials, and industrial sectors. This promotes cyclical value outperformance, which supports the Dow and pushes the index into record territory. The bias for the Dow Jones sees an upside extension to 55000-56500 by end-2026. This bias comes from easing bond yields and strong growth, which favours rotation into stocks.
Bear case: Policy and recessionary risks create a platform for the bear case scenario. Here, growth slows as earnings revisions turn negative. The rise in risk premiums stemming from the recessionary pathway carries downside risk for the Dow Jones Index. The bias is for the Dow to range or grind lower, with an end-2026 price range of 47000-50000.
Dow Jones Index Forecast 2030
The signal checklist for Dow Jones Index forecasts for 2030 include:
- Earnings breadth
- Fed pathway
- Inflation
- Constituent concentration impact
The signal checklist for Dow Jones Index forecasts for 2030 include:
- Earnings breadth
- Fed pathway
- Inflation
- Constituent concentration impact
Yardeni Research has the Dow trading at 60,000 by 2030, basing its thesis on earnings boom assumptions. Axios also quotes Macquarie strategists who are forecasting a 55,000 price by 2030.
These strategist projections do not reflect those of institutional analysts, whose projections typically span 12 months and no longer than two years.
Dow Jones: Technical Outlook
The Dow Jones remains in a strong uptrend, driven by renewed expectations of Fed easing.
Dow was rejected at 49554, the 27% Fibonacci extension level of the 1 August 2025 – 13 November 2025 price swing, which rests near the all-time high (49633). This rejection keeps the Dow in consolidation between this upside barrier and the 48089 support. The bulls need to uncap the 49554 barrier to aim for new highs at 51,256, the 61.8% Fibonacci extension level.
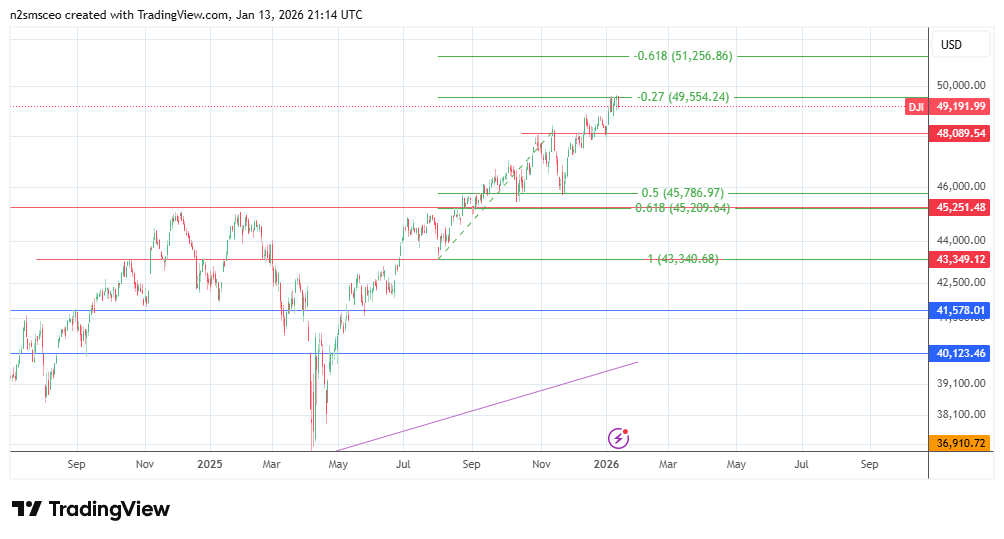
On the flip side, the 45786 support formed by the 21 November 2025 low corresponds to the 50% Fibonacci retracement level. This price mark is the next stop if the bears breach the 48089 support level.
FAQ
What is the Dow Jones Index?
The Dow Jones Index is a composite index made up of the top 30 most capitalized companies in the US stock market.
What is the medium-term outlook for the Dow Jones?
Fed easing expectations and broader earnings base for individual stocks are expected to push the Dow higher in the coming months.
What is the price of the Dow today?
The closing price of the Dow as of 13 January is 49191.