

- Explore the Dow Jones technical outlook, key fundamentals impacting the market, and historical performance for informed investment decisions.
US equity markets surged yesterday in response to the US inflation Figures. The Dow Jones closed up 617.08 points, or 1.36%, reaching an all-time high of $46137.
The S&P 500 also gained 55.43 points, or 0.85%, closing at a record $6592.2. Meanwhile, the Nasdaq 100 rose 143.29 points, or 0.60%, to finish at $25017. These rallies were in response to weak US inflation, which boosted bets on Fed cuts.
During today’s European session, the Dow Jones Index Futures opened lower. Currently trading around $46047, as traders may be taking profits after Thursday’s rally.
Moreover, traders may be cautious ahead of the US Consumer Sentiment Index report, due later today. This article will cover key US fundamentals affecting the equity markets, provide a technical outlook for the Dow Jones Index, highlight its historical performance, and finally address the frequently asked questions.
Dow Jones Index | Key US Fundamentals Affecting the Market:
- US CPI for August 2025 came in slightly hotter than expected, rising 0.4% MoM versus the 0.3% forecast, and 2.9% YoY compared with expectations of 2.8%.
- Core CPI increased 0.3% on the month in line with forecasts, while the annual rate rose 3.1% versus the 3.0% expected.
- The US initial Jobless Claim report showed that claims rose to 263k in the first week of September, above both the forecast of 235k and the prior week’s 236k.
- The non-farm payroll reported a sharp decline; the US economy added only 22k jobs compared to expectations of 75k and 79k in the previous month. This indicates a significant weakness in the US labor market, boosting bets on the Fed’s rate cut.
- The US Michigan Consumer Sentiment Index will be released later today. It’s expected that the worries about the current economy and higher inflation are still hurting consumer spending. This would add pressure on the Federal Reserve to cut interest rates.
Dow Jones Technical Outlook:
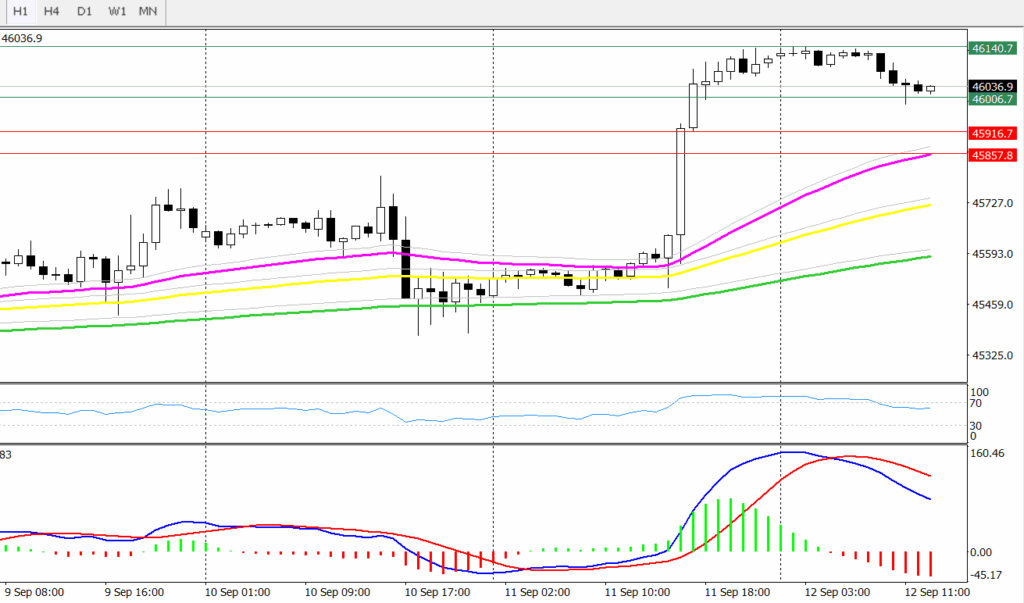
From a technical perspective, the Dow Jones is facing a challenge of consolidating above 46,000. The index is struggling between 46,000 and 46140. A clear 1-hour close below 46,000 could pave the way toward 45,916, the low of September 11, and then the support level at the 50-day moving average of 45,857.
On the 1-hour chart, the MACD signals bearish momentum, and the RSI falls from the 67 level to the 54 level, which indicates that buyers are losing strength, suggesting some selling pressure in the short term. This potentila selling pressure could be profit taking after yesterday’s rally.

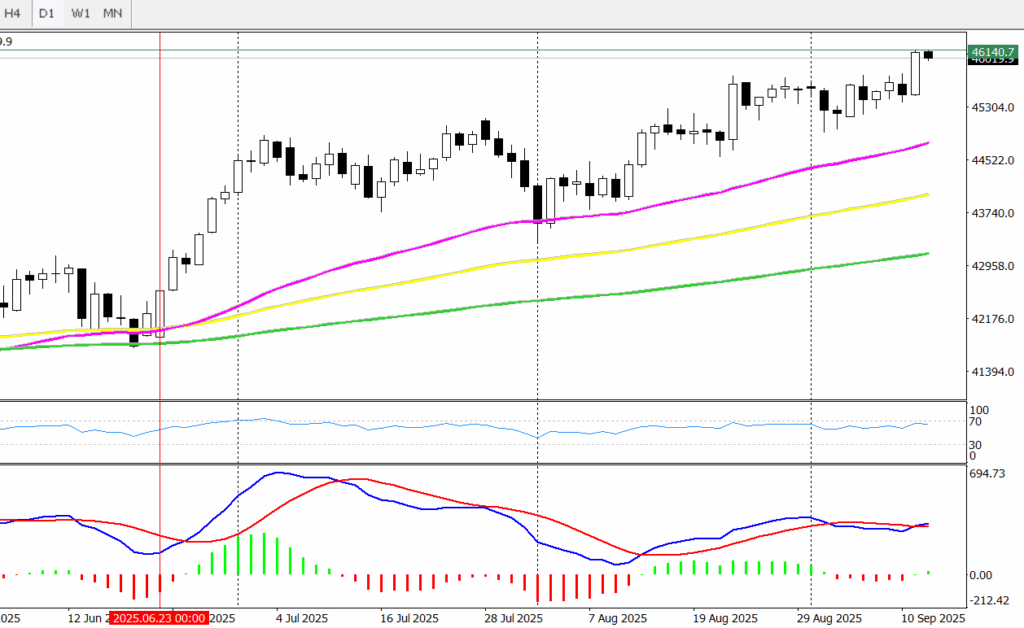
Looking at the Dow Jones Index from a wider angle. The daily chart shows price has been consolidating above the 50-day, 100-day and 200-day moving averages since June 23,2025.
The MACD hase an initial bullish crossover with bullish momentum signals. The RSI near 56, indicating bullish traders remain intact in the long run. This suggests that the Dow Jones may reach new all-time highs, esecially with interest rate cuts. A clear daily close above 46140 could confirm reaching new further highs. Look at what expected for the Dow in Q4.
Dow Jones | Historical Performance :
The Dow Jones has shown a strong positive performance across different time frames. Over the past five days, the index gained 1.07%, while in the past month it advanced 2.66%.
Looking at the three-month period, it posted an increase of 7.31%, highliting steady momentum. Year to date, the Dow Jones is up 8.38%, reflecting solid growth in 2025 so far. On a one-year basis, the index has risen 12.19%, underscoring its sustained bullish trend.
The Dow Jones Industrial Average (DJIA) is one of the oldest and most followed indexes, the Dow Jones Index has long held benchmark status, tracking the performance of industry leaders like Apple, Microsoft, and Boeing. It’s known simply as The Dow, it includes major industrial and multinational firms across diverse sectors. The index comprises 30 of the most prominent blue-chip companies in the United States. Therefore, it offeres a snapshot of the U.S. economy through its carefully selected components.
The Dow jones tracks 30 large, well established US companies across different industries. It’s a price weighted index, higher-price stocks have a bigger impact on the Index.
The S&P500, tracks 500 of largest publicly traded US companies. It’s market cap weighted, so companies with larger valuations influence the index more.
