


- China's economic and financial influence on the rest of the world is growing. The IMF report estimates that Asia's economic growth already accounts for more than 70 % of the world's Gross Domestic Product.
The IMF has issued a report in which it estimates that the Asian economy will grow by 4.6% this year.
It highlights that China and India will grow by 5.2% and 5.9% respectively.
These figures contrast sharply with the growth figures for the United States, which, as I mentioned in previous articles, is very likely to face an economic recession this year.
Just last week, the US presented a cut in year-on-year economic growth estimates to 1.1%.
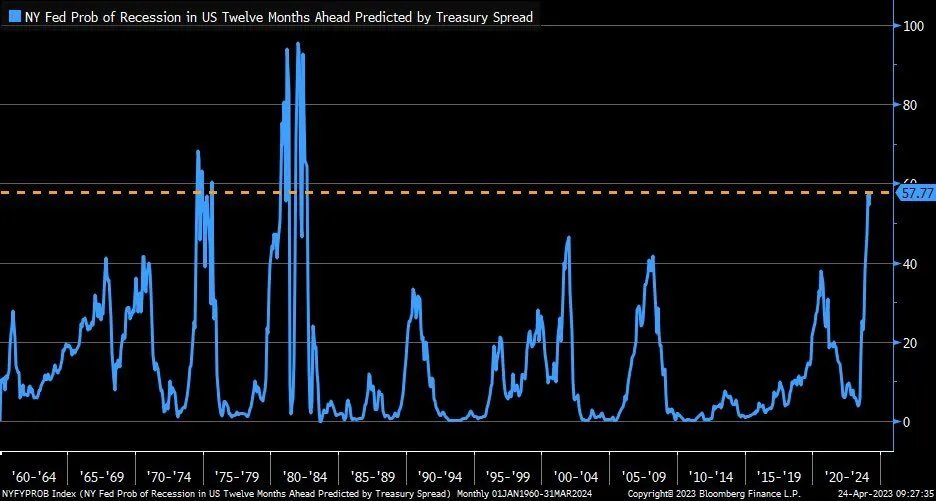
On the other hand, the New York Federal Reserve issues a chart with the recession probabilities of the US economy, and in this case the figure reaches 58% probability of recession this year, the highest value is from the 80s.
Asia’s economic weight increases.
As is already known, China’s economic and financial influence on the rest of the world is growing. The IMF report estimates that Asia’s economic growth already accounts for more than 70 % of the world’s Gross Domestic Product.
The same report also points to Asia and the Pacific region as the most dynamic areas in the world by 2023.
Systemic Risks:
As systemic risks, it points to three main factors:
The first is possible persistent inflation in the world’s major economies, which could weigh on growth.
Second, a decline in global demand, possibly caused by the first factor.
And finally, the third, increased stress in the financial sector stemming from liquidity strains in US banking.
Intrinsic risks:
The IMF stresses that despite China’s high capital and liquidity buffers, the high degree of leverage in its private economy may pose a danger in a scenario of generalised rate hikes, given the high debt costs that its economy would have to bear.

Market Movements:
Given this scenario, I have carried out several analyses on Asian stock markets and in particular on the Chinese stock market, as well as observing the evolution of its currency against the dollar.
I share my thoughts below.
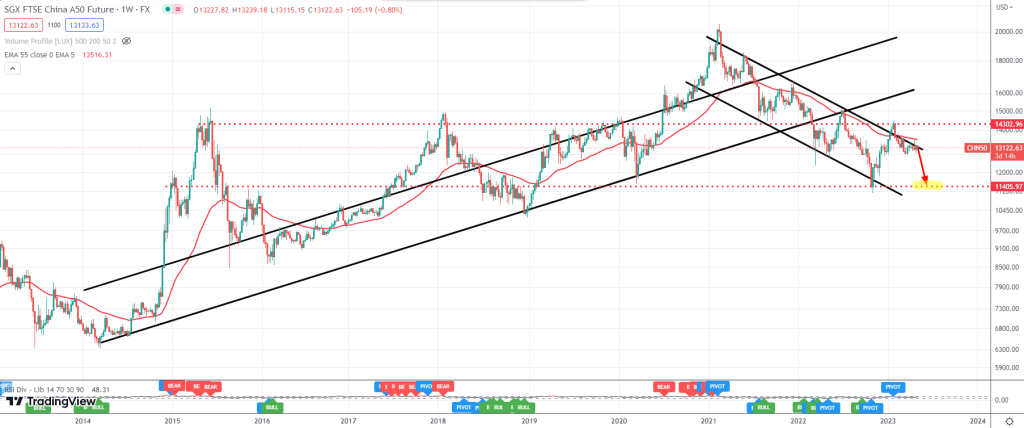
Paradoxically, the Chinese stock market does not seem to be having one of its best moments despite the country’s economic recovery. If you look at the FTSE A50 index, you can see that it has multiple resistance zones above the price, making a downward move towards the 11400 point zone more than likely.
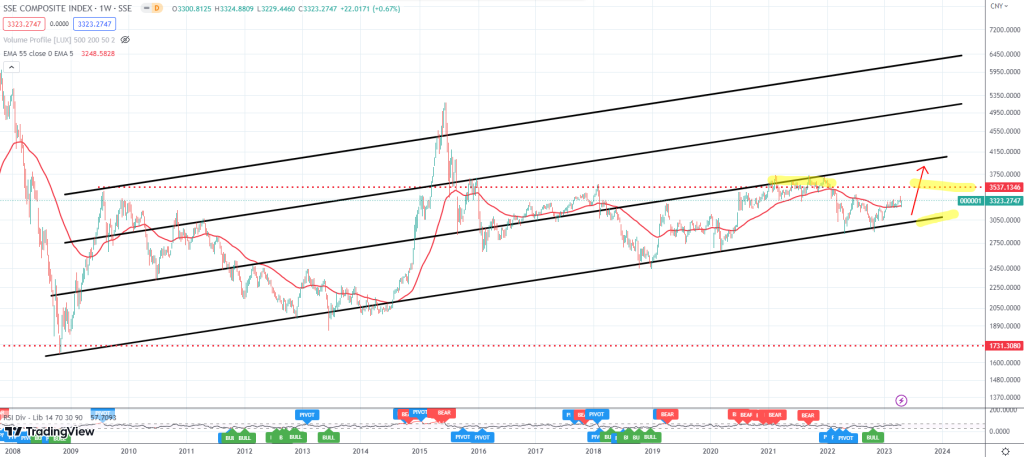
Looking also at the Shanghai stock market index, the Shanghai Composite SSE, it seems to have prices closer to support than the highs. What invites me to think that a bearish movement would be highly probable approaching the index towards the 3000 in coordination with the previous selective.
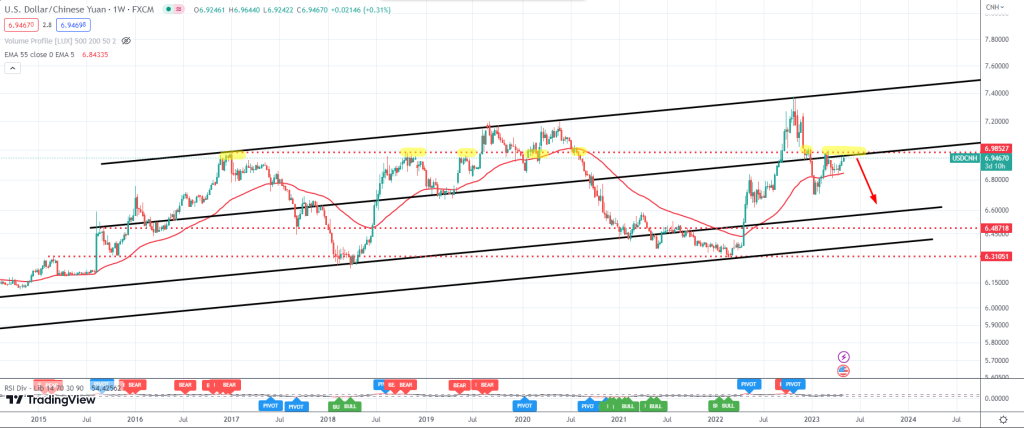
Finally, the Yuan is showing a bearish behaviour against the dollar, with the exchange rate at 7 yuan per dollar. We are close to the lowest Yuan to Dollar exchange rate in the last 10 years, with a high of 7.40 USDCNH.
This could mean that, if there is a corrective movement in the pair towards the 6.60 area, the rise in the Yuan could produce a sell-off in the Chinese stock markets, which would be in line with the movements we have seen in the previous indices.
Please note that this article is not intended to advise or influence any reader’s trading judgement. Financial markets involve high risk, please consult your financial advisor before investing.