
- In this IAG share price forecast, we explain what to expect ahead of the company's quarterly results scheduled on Friday this week
The IAG share price will likely see some volatility this week as the number of Covid cases in some of its key markets rise and as the firm publishes its quarterly results. The stock ended last week at about 168p and rose by about 0.50% after the latest Ryanair earnings.
IAG news: IAG is a large company that operates some of the biggest European airlines like British Airways, AER Lingus, Iberia, FlyLevel, Vueling, Avios, and IAG Cargo. These are significantly different airlines that benefit from different types of customers. For example, British Airways is popular among business travellers while Iberia is popular among tourist travellers.
The IAG share price will react to the latest earnings by the company. In general, analysts expect that the firm’s revenue rose in the second quarter as most people indulged in travelling. Still, it will likely release a loss when it publishes its results on Friday.
Earlier today, its regional competitor, Ryanair published weak results but hinted that it will make a profit in summer. The firm said that it lost a smaller-than-expected loss of more than $322 million in the first quarter. It also expects that it will add more than 90 million customers in 2022. It also pledged to cut fares in a bid to fill seats as it expects to reach a load factor of 90%.
Analysts at Credit Suisse believe that the IAG share price can keep rising. They expect that the firm’s total debt will peak at around 12 billion euros in Q2 with revenue rising to 3 billion euros in the third quarter. IAG is expected to make an operating loss of about 2.8 billion euros. So, what next for the IAG stock price?

IAG share price forecast
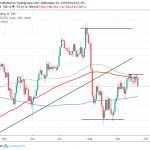
The daily chart shows that the IAG share price peaked at around 221.94p early this year. This was a notable level since it was along the 38.2% Fibonacci retracement level on the daily chart. The price is now 23.5% below the highest point this year. It has also moved below the triangle pattern and the 50-day and 100-day moving averages. The stock has also declined below the neckline of this year’s double-top pattern.
Therefore, the stock will likely maintain the bearish trend as bears target the next key support at 150p. On the flip side, a move above the resistance at 180p will invalidate this view.
IAG stock chart

Follow Crispus on Twitter.