
- The HSBC share price has been in a strong sell-off in the past few days as worries about its Russian exposure rises.
The HSBC share price has been in a strong sell-off in the past few days as worries about its Russian exposure rise. The stock is trading at 495p, which is the lowest since January 25 this year. It has fallen by more than 12% from the highest point this year. The same trend has happened in its Hong Kong listing.
HSBC is the biggest bank in Europe in terms of assets. The company operates mostly in Asia and several European markets. It also operates in Russia through OOO HSBC Bank, a local subsidiary. It does not provide retail services in Russia. Instead, it offers investment and corporate banking and financial markets solutions to companies and high net-worth individuals.
HSBC latest news
The HSBC share price has retreated in the past few days as investors worry about its exposure to a market where the central bank has warned about liquidity. On Tuesday, the company ordered its staff to avoid doing business with sanctioned entities like VTB and VEB.
The impact of this crisis has helped to undo some of the gains the company experienced last week when it published strong results. The company started a $1 billion share buyback on top of the $2 billion it announced in 2021. This is after the company’s adjusted profit rose by 79% in the fourth quarter to $4 billion. It also took a $450 million impairment charge due to the Chinese properties market.

HSBC share price forecast
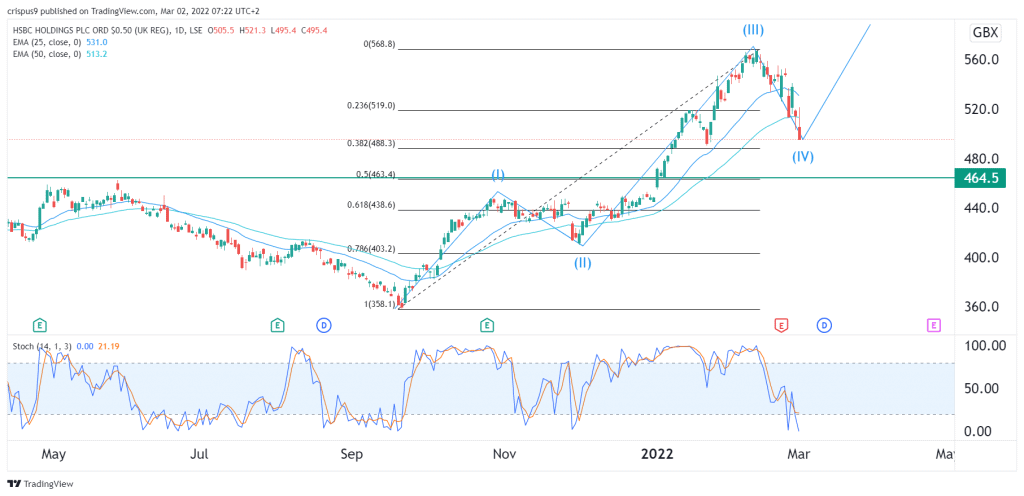
A look at the daily chart shows that the HSBC share price has been in a strong bearish trend in the past few days. As a result, the shares have moved close to the 38.2% Fibonacci retracement level. It has also moved below the 25-day and 50-day moving averages.
A closer look at the daily chart shows that it has formed an Elliot wave pattern and is currently in the fourth phase. Therefore, there is a likelihood that it will soon rebound as it enters its fifth wave of the pattern. A retest of the YTD high of 568p cannot be ruled out. However, a drop below 463p will invalidate the bullish view.