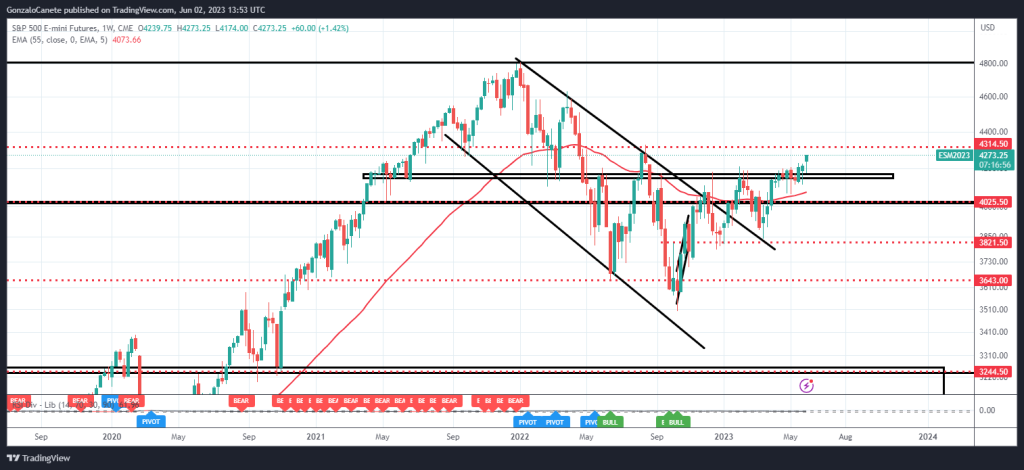


- We leave you the SP500 chart with the key levels defined.
- The current optimism could be exacerbated and precipitated, we call for calm, cautious investors and hedging positions, the more astute investors.
Now that the debt ceiling problem has been solved, which the market has been discounting for the last few days, we can see how, at last, the world’s largest stock market, the SP500, seems to be moving away from the 4200 point ceiling.
The million dollar question will be whether it will be able to hold it. Let’s hope that today’s Friday closes above those levels.
I want to look at what could happen in the long term from now on.
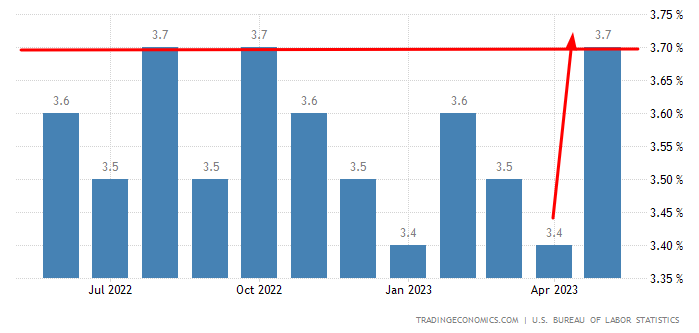
On the one hand, we have the unemployment rate today, which is up but very slightly, remaining below 4%, and with super positive non-farm payrolls data.
Will the Fed rate hike continue?
We have been asked in some media outlets whether the Fed will decide to continue to raise rates this year or not, given these data. The answer is simple, as long as the unemployment rate is below 4%, it can be considered full employment in the US.
A situation of full employment makes it easier for workers to demand a wage increase that is in line with the current inflation rate, otherwise their purchasing power will be reduced due to rising prices.
So far so legitimate, if prices are rising, wages will have to rise so that people do not lose quality of life. Those wage increases will lead to higher labour costs, and those higher labour costs will lead to higher unemployment. The increase in the unemployment rate will reduce demand and consumption, and this will eventually cool inflation.
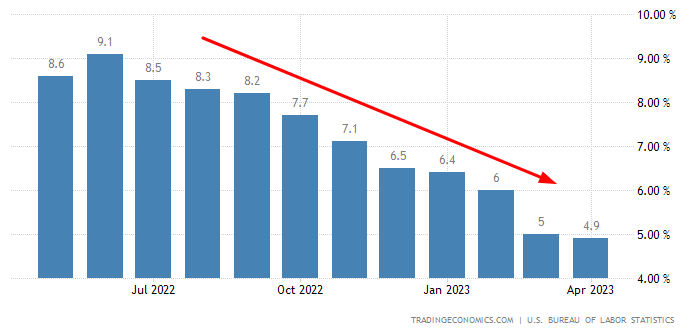
In summary, as long as the US labour market remains strong, we do not expect a reduction in the inflation rate, and therefore it is not out of the question that the Federal Reserve will continue to raise interest rates, given that we are still far from the 2% inflation target rate.
Will there be a correction in the markets?

The announcement of the debt ceiling increase has been interpreted as good news for the market. However, as we have explained in other media, the first thing the US government will do with this debt increase is to borrow new funds from the Fed’s interbank reserve system. This will replenish the balance of its TGA public spending account, but at the same time reduce the money available for other financial assets in the markets.
This is what happened in 2011 with the negotiation of the debt ceiling, precisely this liquidity draining effect is what caused the SP500 to fall by almost 20% in the following months after the agreement.
In conclusion.
We leave you the SP500 chart with the key levels defined.
The current optimism could be exacerbated and precipitated, we call for calm, cautious investors and hedging positions, the more astute investors.