Gold prices continue their ascent, and I suspect the trend will remain bullish as long as the price trades above $1376.
Already in early 2018, I mentioned the possibility of a strong bullish trend in gold prices on a break to the 2016 highs of $1375. However, with the Federal Reserve increasing interest rates in 2018, the appetite for supporting gold prices was limited until the wheels came off the US economy, and stock markets dropped sharply in December 2018. The tone is now different, and gold prices are adjusting themselves for possibly three to four rate cuts by March 2020.
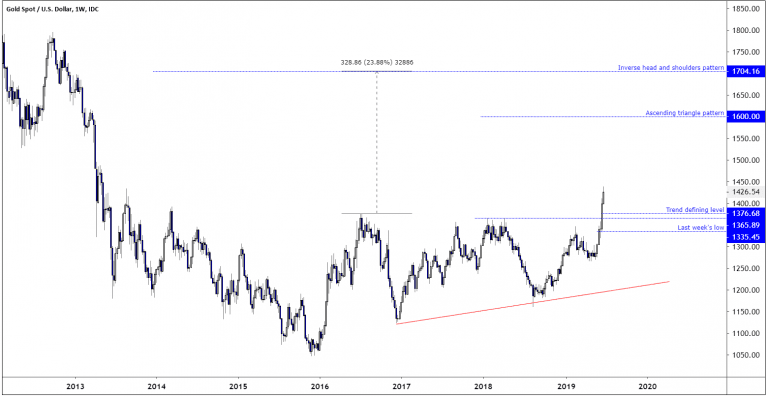
Technically, gold prices triggered two major patterns. The first pattern is a major inverse head and shoulders pattern, with the 2013 low being the left shoulder, the 2015 low at $1046 being the head, and the 2016 low being the right shoulder. This pattern suggests that gold prices might trade as high as $1704. The second pattern is a smaller ascending triangle, formed between June 2016 until 2019, and this pattern trigger on a break to the 2018 high of $1365, and is currently suggesting that Gold prices might trade as high as $1600. These two longer-term patterns will be in play as long as the price does not decisively trade back into the patterns, and trade below last week’s low of $1335.45.
Gold prices weekly chart
Shorter-term traders looking to get involved will probably wait for some corrective pullback to improve the risk-reward-ratio. But any corrections have so far been shallow and since June 20 Asian traders have been very keen on buying gold and many of the runups have been overnight, as on June 20, 21, and 25.
Time will tell if the price will correct lower before heading higher, but I think it is likely. The June 20 London low at $1376 is now considered to be a short-term support level, and on June 21 the prices tested this level once more before gold prices traded higher. Plotting Fibonacci levels from the $1376 low to the current 2019 high at $1439.3 tells us that the $1405 is a level between the 50% and 61.8% correction levels. It is also a price level in the proximity of the June 21 high, and June 24 Asian price range.
As the $1405 level is around potential support levels, I suspect that it will be a level where traders not already long will be interested in buying, and any deeper pullbacks will also be met by buyers as long as the price does not slide below the June 20 low at $1376. If it does, then there is a genuine risk that the last few days rally was all just a short-term move, and the price could start to oscillate again, as they have done since 2013. However, if the price bounces from the above-mentioned interval, we might see gold prices reach short-term target at $1450, followed by $1500.