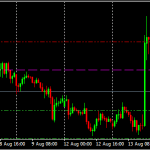
- The recent sell-off in gold price has pushed XAUUSD below support at the $1,700.00 handle. Technicals suggest that it has more downside potential.
In four out of the last five trading days, gold price finished lower against the US dollar. With its recent weakness, the precious metal has slid below the $1,700.00 psychological handle. Technicals also suggest more downside potential.
Bearish Flag on XAUUSD: 1-hour
On the 1-hour time frame, it can be seen that gold price has been aggressively sold off in the last few trading days. What followed is a small consolidation which has consequently allowed for a bearish flag chart pattern to form. This is considered as a bearish continuation pattern. A close below support at $1,681.89 would constitute a downside break and could lead to a bigger sell-off.
Download our Q2 Market Global Market Outlook
Double Top on the Daily Chart
The daily time frame supports this bearish bias too. It can be seen that a double top chart pattern has formed which is also considered as a bearish reversal indicator. Characterized by a market getting rejected at a resistance level twice, gold price could soon fall. A break of the neckline support at $1,671.60 could mean that gold price is on its way to support around $1,585.16 which falls between the 61.8% and 50% Fib levels (when you draw from the low of March 20 to the high of April 14).
Before You Sell…
With this, it’s worth reiterating that gold price still has not yet broken the neckline. This means that it’s still possible for it to trade higher. An upside break of the consolidation at $1,690.30 on the 1-hour time frame could mean that there are still buyers in the market. Should this happen, it could signal that gold price may be on its way to $1,721.42.


