
- Gold prices at the spot market came within touching distance of $2200 on Friday. Could the fundamentals could support success on Monday?
Gold takes another stab at $2200 on Monday, after facing rejection at that level on Friday. Gold prices hit a new all-time high on Friday when it touched $2195 an ounce on the spot market. However, gold went marginally above $2200 when futures gold touched an all-time high $2203 on the same day. Gold futures traded at $2186, while spot gold was at $2178 at press time. A breach past the $2200 barrier mark on Monday will not only see it reach a fifth ATH in a week, but also complete a 10-day winning streak against the dollar.
Anticipated Fed rate cuts prop up gold prices
The Federal Reserve is expected to cut interest rate cuts in June, and this has seen a significanty flight of investments toward safe haven gold. A reduction in the current 5.25%-5.5% interest rates will mean reduced yields on multiple assets, key among them, US government-issued bonds. Therefore, investors are strategically readjusting their portfolio in response.
The US dollar has weakened over the past two weeks, underscored by the performance of the DXY index. The DXY has ended the day in red over the past six sessions, and stand near three-month lows at 102.7 at the time of writing.
A spike in China’s appetite for gold
Gold prices have also received a substantial spike in central bank-led bullion buying. China has taken the lead in that front, and its central bank raised its gold imports for the sixth consecutive month in February, bringing in 390,000 troy ounces. The Chines government has also lifted restrictions on gold imports, opening a new avenue for inflows into the gold market.

Also, investors in the world’s second-largest economy are cushioning themselves against the impacts of reduced growth rate after years of economic boom. According to UBS, mainland China, and Hong Kong collectively accounted for more than half of all gold shipments globally in January.
Technical analysis
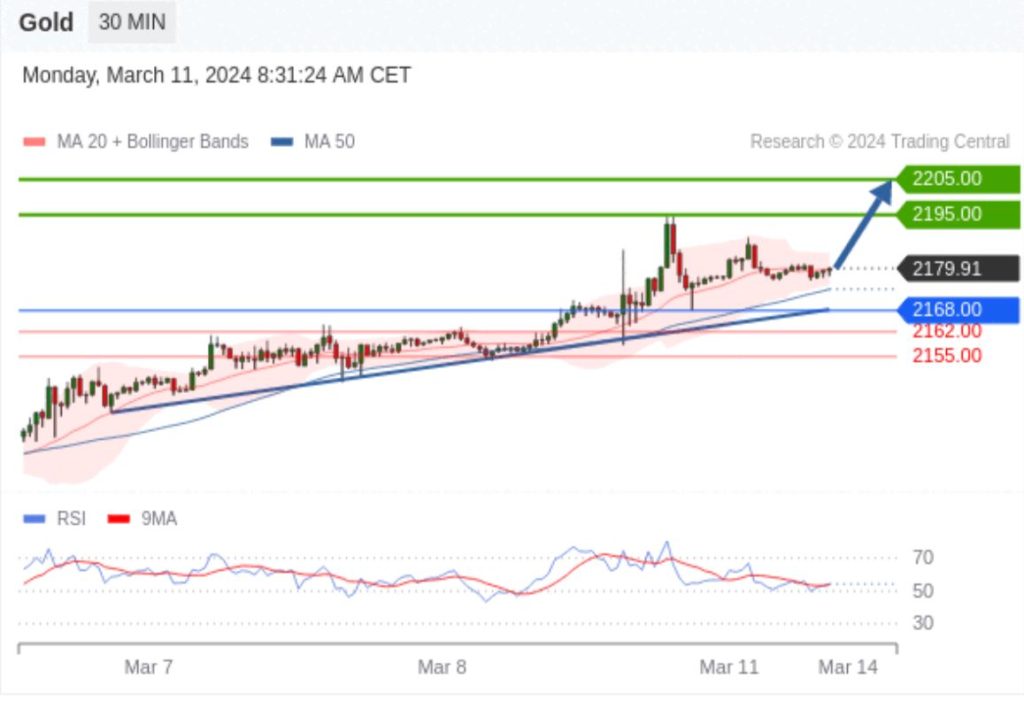
The RSI indicator on the 30-minute gold price chart signals control by the buyers, above the $2168 pivot mark. This means that the bulls will likely break the $2195 resistance on continued control above the pivot. The resultant momentum could then support upside propulsion to $2205. However, a move below $2168 will favour control by the buyers, with the downside momentum possibly breaching the support at $2162. Continued control by the bears at that level will invalidate the bullish narrative and could see further losses to test the $2155 support.