

- Gold price breaks finally today above the recent trading range making fresh monthly highs. Actually confirming what we have discussed in our latest gold
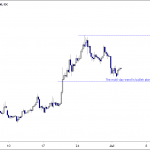
Gold price breaks finally today above the recent trading range, making fresh monthly highs. Confirming what we have discussed in our latest gold analysis: Gold Price Trapped in Rectangle Formation, A Break Higher Looks Possible. Today’s move gives the bulls strong momentum for a test of the yearly highs. The consolidation phase between $1,710 and $1,738 it was intact for almost a month so that a break could signal a significant move to the upside.
A rising number of confirmed coronavirus cases in the USA increase investors concerns for the second wave of infections that would halt the recent recovery. At the same time, it will eliminate any thoughts for a V-Shaped recovery. The Apple decision to re-close about 11 stores in Florida also weighs on investment sentiment and traders shift their attention to safe-haven assets.
Gold prices also getting a hand from a falling USD, while the speculators increased the bullish positions in gold futures contracts in the week ending June 16, as per the CFTC announcement on Friday.
Download our Q2 Market Global Market Outlook
Gold Price Daily Technical Analysis
Gold price is 0.15% higher at $1,745 breaking the upper bound of the recent consolidation phase. Bulls are now positioning for a test of the yearly highs, as the bullish momentum gains traction above $1,738. What can cancel the bullish momentum is a break below the 50-day moving average at $1,716 (50-day moving average).

Looking to higher levels now traders will face the first resistance at $1,758 the daily top (also monthly high). If the gold price breaks above 1,758, then the next resistance would be met at $1,765 the high from May 18th.
On the other hand, the immediate support for gold price stands at $1,741 the daily low, while more buying interest might emerge at $1,716 the 50-day moving average. In case the bears continue the pressure, then the next support area stands at $1,692 the low from June 9th.