


- The gold price forecast is for the XAU/USD pair to consolidate between 1900 and 2000 in the short to medium term.
The price of gold, represented by the XAU/USD pair, is down nearly 1% this Thursday. The price decline comes as rising bond yields drive investment flows away from the non-yielding yellow metal. This Thursday, risk sentiment improved after Tesla’s strong earnings and a surprise profit prediction by United Airlines for the current quarter. This is also contributing to the selloff in gold prices.
Inflation (for which gold is a hedge) and bond yields define immediate trade setups on the yellow asset. Long-term bond yields are gaining ground as expectations that the Fed will embark on an aggressive rate tightening path continue to mount. Red-hot inflation numbers continue to drive this expectation.
Additional fundamental triggers for gold prices are expected today from two central bank chiefs. A panel discussion in the International Monetary Fund/World Bank Group’s Spring Meetings scheduled for Thursday will host ECB Chair Christine Lagarde and her US counterpart Jerome Powell. The panel discussion, dubbed “Debate on the Global Economy”, could provide some insight into the future monetary policy in the US and the Eurozone. Unscripted comments are likely to create some volatility in the XAU/USD pair and reshape gold price forecasts in the medium term.
Gold Price Forecast
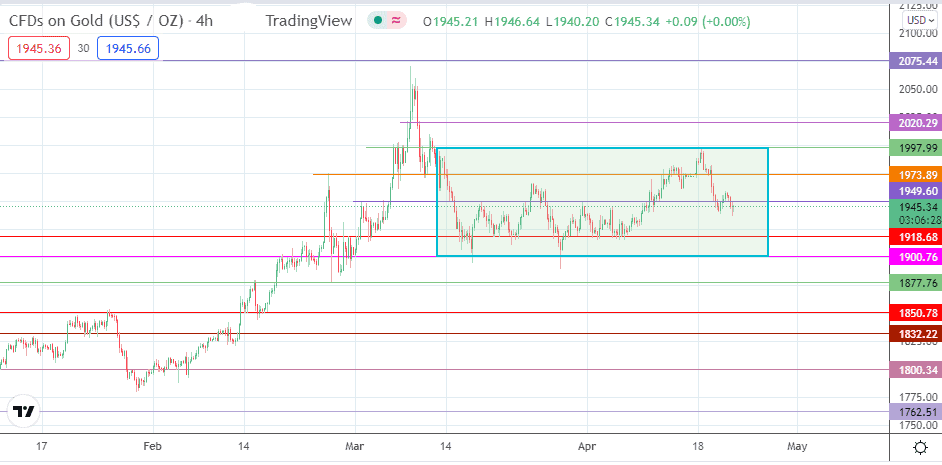
The gold price forecast in the short term points to some consolidation. Within the consolidation zone demarcated by the rectangle on the 4-hour chart, the price action has broken below the 1949.60 support. As a result, additional downside momentum is required to bring 1918.68 into the picture as the next downside target. Below this support line, the rectangle’s floor at 1900.76 forms another downside boundary. Only when this support gives way will additional targets to the south at 1877.76 and 1850.78 enter the mix.

On the flip side, a break of 1997.99 (rectangle’s ceiling) provides the opening the bulls need to push above the 2,000 psychological support, targeting 2020.29 before 2050.00 (8 March high) comes into the picture. But, first, the bulls need to uncap the resistance at 1949.60 and 1973.80 (24 February high) before this outlook gains traction.
XAU/USD: Daily Chart
Follow Eno on Twitter.