
- Gold price is forming a bullish pattern ahead of the NFP data that will be released today. Also, the price is consolidating even as billionaires buy more
Gold price remained in a holding pattern as investors waited for the US nonfarm payrolls data that will be released later today. On the daily chart, gold appears to be setting up a significant bullish breakout.
Paul Tudor Jones gold prediction
Gold price was little changed even as Jones predicted that the price would soar to $2,400 in the next few months. He revealed this when he sent a note to his investors claiming that he had bought Bitcoin as a hedge against inflation. In the note, he talked about how central bankers action could lead to higher inflation as they debased the value of money. He wrote:
“The most compelling argument for owning Bitcoin is the coming digitization of currency everywhere, accelerated by Covid-19.”
Jones becomes the latest billionaire to be long gold. As I wrote a while back, billionaires like Paul Singer and Ray Dalio had rushed to invest in gold arguing that the current environment was perfect for the metal. Caxton Associates, another hedge fund has also invested in gold.
Other analysts have remained bullish on gold. Last month, I wrote that analysts at Bank of America were predicting that the price would jump to $3,000. Also, analysts at Goldman Sachs have been advising clients to invest in gold.
Gold prices waits for NFP data
Gold is usually associated with the dollar movements. Therefore, the current low volatility is possibly because analysts are seeing a calm before the storm for the price. Highly negative data could prompt the Federal Reserve to provide more liquidity, which would be a good thing for the price of gold.

Download our Q2 Market Global Market Outlook
Gold price technical outlook
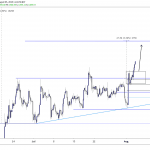
In my previous report on gold prices, I used a longer-term chart to predict the movement of the metal. The report showed that gold was making a cup and handle pattern and that it was heading to the all-time high of $1920.
In this report, let us look at the daily chart. We see that gold price has been consolidating near the YTD high of $1,746. At the same time, the price appears to have formed a bullish pedant pattern, which is shown in blue. Most interestingly, the price has formed a bullish engulfing pattern. Therefore, I expect the price to at least test the YTD high today.
On the other hand, a move below $1647 will invalidate this action. This price is at the confluence of the 50-day EMA and the lowest part of the hammer pattern that happened on April 21.