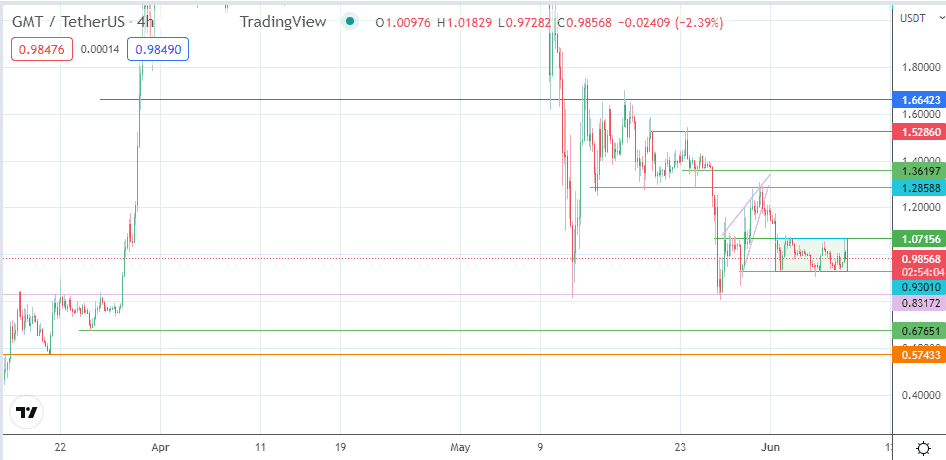


- The break of the rectangle pattern will determine the direction of any GMT price prediction in the near term.
The GMT/USDT pair saw a high spike in the 15-minute candle in the early hours of Wednesday. However, those on the verge of making bullish GMT price predictions ended up disappointed as the candle retreated with a lengthy shadow, keeping the price action within the range formed by the 1.07156 resistance (ceiling) and the 0.93010 support (floor). Here is the GMT price prediction for day traders.
The Greenwich Metaverse Token did not suffer the slide other tokens suffered on Tuesday night. Instead, the bulls posted a brief run to the upside, but this move was truncated at the 1.07156 resistance. As a result, the price action has now condensed into a tight range, forming a rectangle pattern. The expectation is for the pattern to resolve in the direction of the previous trend.
Preceding the rectangle is the breakdown move which followed the resolution of the rising wedge pattern. The completion point of the measured move from the wedge coincided with the 0.93010 price support, which forms the lower boundary of the rectangle.
The preceding trend remains indeterminate, and traders can make their GMT price predictions from the direction of the rectangle’s breakout.
GMT Price Prediction
The price action currently trades within the identified floor and ceiling. This forms a rectangle pattern. A further ascent in price requires the bulls to break the 1.07156 ceiling. This will open the door for a move toward the 1.28588 resistance.

A potential pitstop awaits the bulls at 1.2000, as this is a psychological price mark and the location of the 29 May 2022 high. If the bulls push the advance beyond 1.28588, the next target awaits them at 1.36197 (23 May low). Finally, 1.52860 (23 May high) forms an additional northbound target.
On the flip side, the bears would see some joy if the 0.93010 support gives way. This scenario makes the 0.83172 price level (27 May 2022 low) a new target for the downside action. There is also a potential for a further decline to 0.57433, site of the 21 March 2022 low. However, there is an intervening obstacle in the form of the 25 March 2022 low at 0.67651. This obstacle must give way before the 0.57433 price mark comes into the picture.
GMT/USDT: Daily Chart